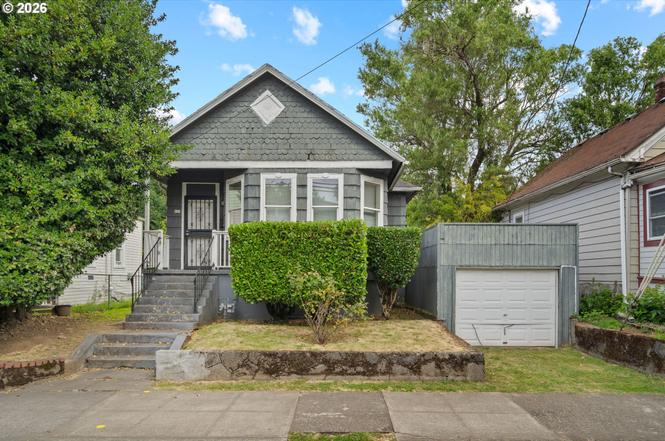
113 NE Fremont St
Portland, OR 97212
$399,000C
3 bd · 2.0 ba ·
1,226 sqft ·
Built 1906
· MultiFamily
· Active
· 1 DOM
Cashflow @ list (25.0% down · 7.5%)
Estimated rent
$4,396/mo
Mortgage (P&I)
−$2,092
Tax + insurance
−$718
HOA
−$0
Vac / Maint / Mgmt
−$923
Net cashflow
$663/mo
Annual
$7,952/yr
Cap rate
8.29%
Cash-on-cash
7.12%
DSCR
1.32
1% rule
1.10%
Cash to close
$111,720
Investor read
- This is a 2 × 3-bed/2.0-bath units multifamily listed at $399k.
- At list price, monthly cash flow is $663 ($8k/yr) — positive. Per door: $331/mo.
- The deal already cash-flows at list — no discount required.
- Meets the 1% rule at list price ($4k rent vs $399k).
- Only 1 days on market — expect competitive offers; lowballing is unlikely to land.
- Local home prices are declining (-3.0%/yr); year-one equity from $3k of loan paydown is wiped out by about $12k of value loss. Plan a longer hold.
- Location reads 77/100 on livability (#72 in OR, #3,256 nationally) — a middle-class / working-renter tenant base. Strengths: amenities A+, commute A+, health & safety A+; Watch: crime F, cost of living F.
- Portland SD 1J (urban): math 46% / reading 58% proficiency, ranked #23 of 183 in OR (top 13%) — acceptable for families but not a draw, mixed tenant base, ~2y average lease.
- Zoned schools: Boise-Eliot Elementary School (326 students, 71% FRL); Harriet Tubman Middle School (360 students, 65% FRL); Jefferson High School (606 students, 64% FRL) — zoned schools average 67% FRL vs 37% district-wide (30 pts higher); higher-poverty schools than district average — tighter screening recommended.
- Watch-outs: built in 1906 — expect roof / HVAC / electrical / plumbing capex.
- Market conditions: Rents rising (+3.5%/yr); 128 active listings in the ZIP; 40 comparable units currently listed for rent nearby; rentals leasing fast (median 12d on market — plan ~1-2 weeks tenant-placement turnaround); high-income renter base; 2,041 units permitted in Multnomah County in 2024 (905 in 5+ unit buildings).
- Multnomah County population projected at +33% by 2050 — long-run rental-demand tailwind backs the buy-and-hold thesis.
- Cap rate 8.3% vs local median 2.2% in Portland — top-decile yield for the area; either an underpriced asset or a hidden risk that comps aren't pricing in. Stress-test before assuming the spread holds.
- This rent runs 40% of the median local income ($132k/yr) — at the standard rent-burdened threshold; future hikes will face affordability resistance.
Questions for listing agent
- Can we see the unit-by-unit rent roll, current vacancy, and any below-market leases? What's the average tenancy length?
- What capital expenditures (roof, boiler, parking lot, exteriors) have been made in the last 5 years, and what's planned in the next 2?
- Built in 1906 — when were the roof, HVAC, electrical panel, plumbing, and water heater last replaced?
- Is there a deadline driving the sale (1031 exchange, divorce, estate, relocation)? That informs how much negotiation room exists.
- Crime grade is F in this area — have there been break-ins, vandalism, or insurance claims at this property in the last 3 years? What carrier currently insures it and at what premium?
- What's the average days-on-market for RENTAL listings here right now (not sales)? A rising rental-DOM trend means longer vacancies and softer asking-rent achievability than the comps imply.
- What's the recent tenant-quality profile in this submarket — average credit score on applications, eviction rate, late-payment / NSF rate, and stable-employment percentage? A property-management company in the area should have these aggregated.
- How much new apartment / multifamily construction is in the pipeline within 1–3 miles? Heavy new supply (>2% of stock underway) typically softens rents 12–24 months out; light construction supports rent growth.
CashFlowRE · CFR-WD0TWR7YGD2DED
· Data 1 day ago
cashflowre.app · 2026-05-29