 Duplex
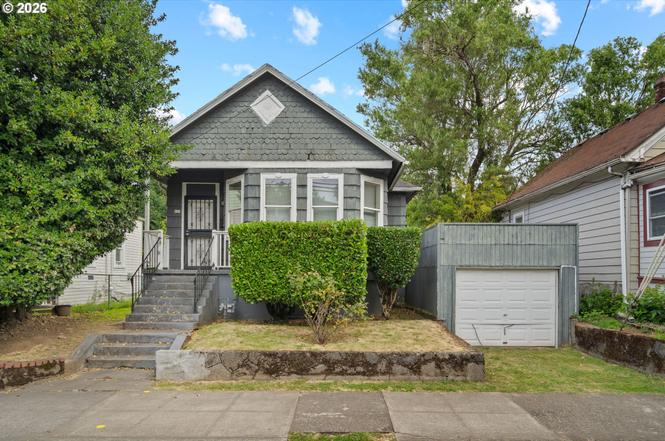
113 NE Fremont St · Portland, OR
Flood risk 1/10 · Minimal
- FEMA flood zone
- X (unshaded)
- Chance of flooding over 30 yrs
- 0.0%
- Est. flood insurance / yr
- $473 – $860
Fire risk 1/10 · Minimal
- Est. fire insurance / yr
- $498 – $926
Heat risk 3/10 · Minor
- Hot days now (above 92°F)
- 7 days/yr
- Hot days in 30 yrs
- 14 days/yr
Wind risk 1/10 · Minimal
- Chance of severe wind over 30 yrs
- —
Air-quality risk 10/10 · Severe
- Unhealthy air days now
- 19 days/yr
- Unhealthy air days in 30 yrs
- 20 days/yr
Risk factors via First Street. Map © Google.
Why this score? — see what drove the C grade
The composite is a weighted blend of 9 inputs, each scored 0–100. Each bar is that input's sub-score; the figure is the points it added to the 100-point composite (weight × sub-score).
- Cash flow +22.4/30.0
- ARV discount +7.5/15.0
- DSCR +7.2/10.0
- 1% rule +6.0/10.0
- Schools +4.7/10.0
- Livability +3.9/5.0
- Rent growth +3.4/5.0
- Condition / age +2.5/5.0
- Appreciation +0.0/10.0
$399,000
🖨 Deal sheet 📄 Offer letter ✓ Due diligence
Multi-family units
County records classify this as Multi-Family (2-4 Unit). Listing-text estimate: 2 units. confirmed
Listing remarks
This fixer duplex presents an excellent opportunity for investors, builders, or buyers looking to add value through renovation. Featuring two separate living units, this property offers flexible possibilities for rental income, multi generational living, or a complete redevelopment vision. The home is in need of updates and repairs, making it ideal for those seeking a project with upside potential. Situated on a convenient urban lot in a sought after Northeast Portland location, the property enjoys close proximity to local restaurants, shops, parks, public transportation, and the vibrant amenities that make this area so desirable. Whether you're looking to restore its character, modernize t
Key facts
- Build equity
- Convenient urban lot
- 4,791 sq ft lot
Tags
Property features AI
Finance
- Other: Zoned R2.5; Parcel number R103099; Lot range approximately 3,000 to 4,999 sq ft (about 0.11 acres)
Exterior
- Parking: Garage and on-street parking; 1-car garage
- Utilities: Electricity and gas available; Public water; Public sewer
- Home design: Multi-family property; Not attached; No view; Built in 1906
- Construction: Composition roof
- Exterior features: Wood siding; Paved road access
Interior
- Kitchen: Electric hot water
- Bedrooms: Unit 1: 2 bedrooms; Unit 2: 1 bedroom
- Bathrooms: Unit 1: 1 bathroom; Unit 2: 1 bathroom
- Heating & cooling: Forced air heating; No cooling
- Interior features: Full basement; Storage in basement and garage
- Laundry & utility: Garage utility/storage space
Neighborhood map
What this means for you Summary
Snapshot
- This is a 2 × 3-bed/2.0-bath units multifamily listed at $399k.
Deal economics
- At list price, monthly cash flow is $663 ($8k/yr) — positive. Per door: $331/mo.
- The deal already cash-flows at list — no discount required.
- Meets the 1% rule at list price ($4k rent vs $399k).
- Cap rate 8.3% vs local median 2.2% in Portland — top-decile yield for the area; either an underpriced asset or a hidden risk that comps aren't pricing in. Stress-test before assuming the spread holds.
Location & tenants
- Location reads 77/100 on livability (#72 in OR, #3,256 nationally) — a middle-class / working-renter tenant base. Strengths: amenities A+, commute A+, health & safety A+; Watch: crime F, cost of living F.
- Portland SD 1J (urban): math 46% / reading 58% proficiency, ranked #23 of 183 in OR (top 13%) — acceptable for families but not a draw, mixed tenant base, ~2y average lease.
- Zoned schools: Boise-Eliot Elementary School (326 students, 71% FRL); Harriet Tubman Middle School (360 students, 65% FRL); Jefferson High School (606 students, 64% FRL) — zoned schools average 67% FRL vs 37% district-wide (30 pts higher); higher-poverty schools than district average — tighter screening recommended.
- Market conditions: Rents rising (+3.5%/yr); 128 active listings in the ZIP; 40 comparable units currently listed for rent nearby; rentals leasing fast (median 12d on market — plan ~1-2 weeks tenant-placement turnaround); high-income renter base; 2,041 units permitted in Multnomah County in 2024 (905 in 5+ unit buildings).
- This rent runs 40% of the median local income ($132k/yr) — at the standard rent-burdened threshold; future hikes will face affordability resistance.
Forward outlook
- Local home prices are declining (-3.0%/yr); year-one equity from $3k of loan paydown is wiped out by about $12k of value loss. Plan a longer hold.
- Multnomah County population projected at +33% by 2050 — long-run rental-demand tailwind backs the buy-and-hold thesis.
Negotiation context
- Only 1 days on market — expect competitive offers; lowballing is unlikely to land.
Risks & watch-outs
- Watch-outs: built in 1906 — expect roof / HVAC / electrical / plumbing capex.
Questions for the listing agent
- Can we see the unit-by-unit rent roll, current vacancy, and any below-market leases? What's the average tenancy length?
- What capital expenditures (roof, boiler, parking lot, exteriors) have been made in the last 5 years, and what's planned in the next 2?
- Built in 1906 — when were the roof, HVAC, electrical panel, plumbing, and water heater last replaced?
- Is there a deadline driving the sale (1031 exchange, divorce, estate, relocation)? That informs how much negotiation room exists.
- Crime grade is F in this area — have there been break-ins, vandalism, or insurance claims at this property in the last 3 years? What carrier currently insures it and at what premium?
- What's the average days-on-market for RENTAL listings here right now (not sales)? A rising rental-DOM trend means longer vacancies and softer asking-rent achievability than the comps imply.
- What's the recent tenant-quality profile in this submarket — average credit score on applications, eviction rate, late-payment / NSF rate, and stable-employment percentage? A property-management company in the area should have these aggregated.
- How much new apartment / multifamily construction is in the pipeline within 1–3 miles? Heavy new supply (>2% of stock underway) typically softens rents 12–24 months out; light construction supports rent growth.
Investment metrics
- 1% rule
- 1.10% ✓
- Cap rate
- 8.29%
- Cash-on-cash
- 7.12%
- DSCR
- 1.32
- GRM
- 7.6
CMA / ARV
No comps found within radius.
Projected returns pro-forma
-3.0% appreciation · 3.49% rent growth · sell at horizon
- IRR
- -4.8%
- Equity multiple
- 0.82×
- Total profit
- $-20,172
- Equity at exit
- $59,492
- IRR
- 5.5%
- Equity multiple
- 1.41×
- Total profit
- $46,209
- Equity at exit
- $34,498
Cash invested: $111,720 (down + closing). Projections, not guarantees.
Landlord ↔ Tenant lean methodology
- Overall (CITY)
- 0 Strongly Tenant-Friendly
- State Oregon
- 28 Tenant-Leaning · D+6
- County
- — inherits STATE
- City Portland
- 0 Strongly Tenant-Friendly · D+39
ZIP-level market 97212
- Rents YoY
- 3.5%
- Active inventory
- 128
- Price-to-rent
- 15.1×
Monthly cashflow live
- Estimated rent
- $4,396 high interval (Pro) →
- Mortgage (P&I)
- −$2,092
- Tax from tax record
- −$552 /mo · $6,618/yr
- Insurance
- −$166
- HOA
- −$0
- Vacancy / Maint / Mgmt
- −$923
- Net cashflow
- $663
Break-even live
2-unit breakdown (identical units grouped — click to expand)
| Units | Beds | Baths | Est. rent |
|---|---|---|---|
| 2× units | 3 | 2 | $4,396 |
| #1 | 3 | 2 | $2,198 |
| #2 | 3 | 2 | $2,198 |
| Total (2 units) | $4,396 | ||
UW: 25.0% down · 7.5% · 30yr · 1.5% tax · 5.0% vac · 8.0% maint · 8.0% mgmt
Financing live
Cash to close
- Down payment
- $99,750
- Closing costs
- $11,970
- Reserves months
- —
- Total cash needed
- —
Loan-product check · same deal, 3 products live
Conventional
25% down · 7.5% · 30yr
- Down + closing
- —
- Monthly P&I
- —
- Monthly cashflow
- —
- DSCR
- —
- Eligible?
- —
Personal DTI + credit; lowest rate.
DSCR
20% down · 8.5% · 30yr
- Down + closing
- —
- Monthly P&I
- —
- Monthly cashflow
- —
- DSCR
- —
- Eligible?
- —
No personal income docs; deal must DSCR.
Hard money
10% down · 12.0% · 12mo
- Down + closing
- —
- Monthly P&I
- —
- Monthly cashflow
- —
- DSCR
- —
- Eligible?
- —
Short-term bridge; refi at stabilization.
Rent comps 40 comps
| Address | Beds | Baths | Sqft | Rent | $/sqft | DOM | Units | Dist |
|---|---|---|---|---|---|---|---|---|
| 30 NE Fremont St Portland, OR | 3.0 | 1.0 | 642 | $1,825 | $2.84 | 43d | 1 | 0.10mi |
| 3572 NE Garfield Ave Unit 3588 Portland, OR | 2.0 | 2.5 | 1136 | $2,495 | $2.20 | 7d | 1 | 0.10mi |
| 3572 NE Garfield Ave Unit 3584 Portland, OR | 2.0 | 2.5 | 1136 | $2,450 | $2.16 | 24d | 1 | 0.10mi |
| 3450 N Williams Ave Portland, OR | 2.0 | 1.0 | 810 | $2,375 | $2.93 | 7d | 7 | 0.11mi |
| 3600 N Williams Ave Portland, OR | 1.0–2.0 | 1.0–2.0 | 729 | $2,475 | $3.39 | 17d | 1 | 0.14mi |
| 315-317 NE Beech St Unit 1309843P Portland, OR | 3.0 | 1.0 | 1453 | $6,040 | $4.16 | 2d | 1 | 0.14mi |
| 317 NE Beech St Unit 1309851P Portland, OR | 3.0 | 1.0 | 1453 | $6,108 | $4.20 | 15d | 1 | 0.15mi |
| 425 NE Fremont St Unit 3515 Portland, OR | 2.0 | 2.5 | 1314 | $2,450 | $1.86 | 2d | 1 | 0.15mi |
| 3515 NE Grand Ave Portland, OR | 2.0 | 2.5 | 1314 | $2,450 | $1.86 | 2d | 1 | 0.16mi |
| 107 N Cook St Portland, OR | 2.0 | 1.0–2.0 | 736 | $2,677 | $3.63 | 4d | 23 | 0.17mi |
| 3270 N Vancouver Ave Portland, OR | 1.0–2.0 | 1.0–2.0 | 680 | $2,351 | $3.45 | 2d | 6 | 0.20mi |
| 312 NE Monroe St Unit 202 Portland, OR | 2.0 | 1.5 | 775 | $1,650 | $2.13 | 4d | 1 | 0.21mi |
| 312 NE Monroe St Unit 204 Portland, OR | 2.0 | 1.5 | 775 | $1,800 | $2.32 | 24d | 1 | 0.21mi |
| 21 NE Morris St Portland, OR | 2.0 | 1.5 | 1000 | $1,875 | $1.88 | 2d | 1 | 0.24mi |
| 3951 N Williams Ave Portland, OR | 2.0 | 1.0 | 743 | $1,450 | $1.95 | 4d | 1 | 0.28mi |
| 3955 N Vancouver Ave Unit B Portland, OR | 2.0 | 1.0 | 750 | $2,100 | $2.80 | 2d | 1 | 0.32mi |
| 4150 N Williams Ave Portland, OR | 1.0–2.0 | 1.0–2.0 | 741 | $2,475 | $3.34 | 17d | 1 | 0.44mi |
| 4141 N Williams Ave Portland, OR | 1.0–2.0 | 1.0–2.0 | 789 | $2,923 | $3.70 | 2d | 21 | 0.45mi |
| 547 NE Knott St Portland, OR | 2.0 | 1.5 | 1200 | $2,550 | $2.12 | 43d | 1 | 0.45mi |
| 823 NE Mason St Portland, OR | 2.0 | 1.0 | 1000 | $2,250 | $2.25 | 43d | 1 | 0.51mi |
| 506 NE Russell St Portland, OR | 2.0 | 1.0 | 800 | $2,350 | $2.94 | 43d | 1 | 0.51mi |
| 4207 NE 8th Ave Unit B Portland, OR | 2.0 | 1.5 | 1115 | $2,399 | $2.15 | 43d | 1 | 0.51mi |
| 4412 NE Grand Ave Portland, OR | 3.0 | 2.5 | 1376 | $3,095 | $2.25 | 11d | 1 | 0.53mi |
| 3850 N Mississippi Ave Portland, OR | 1.0–2.0 | 1.0–2.0 | 853 | $2,683 | $3.14 | 2d | 15 | 0.57mi |
| 46 NE Sacramento St Apt C Portland, OR | 2.0 | 2.0 | 1150 | $1,795 | $1.56 | 43d | 1 | 0.57mi |
| 3309 N Mississippi Ave Portland, OR | 1.0–2.0 | 1.0–2.0 | 833 | $2,664 | $3.20 | 2d | 14 | 0.58mi |
| 4540 N Vancouver Ave Portland, OR | 2.0 | 2.5 | 1200 | $2,495 | $2.08 | 43d | 1 | 0.58mi |
| 430 NE Sacramento St Unit 432 Portland, OR | 2.0 | 1.0 | 988 | $1,395 | $1.41 | 22d | 1 | 0.61mi |
| 3325 N Michigan Ave Portland, OR | 1.0–3.0 | 1.0–1.5 | 718 | $2,257 | $3.14 | 1d | 4 | 0.63mi |
| 206 N Blandena St Portland, OR | 2.0 | 1.5 | 1009 | $2,395 | $2.37 | 4d | 1 | 0.64mi |
| 4065 N Mississippi Ave Unit 1309852P Portland, OR | 3.0 | 2.0 | 1033 | $7,996 | $7.74 | 24d | 1 | 0.67mi |
| 4124 N Mississippi Ave Portland, OR | 3.0 | 2.0 | 1300 | $4,000 | $3.08 | 11d | 1 | 0.68mi |
| 3647 N Missouri Ave Portland, OR | 2.0 | 1.0 | 800 | $2,100 | $2.62 | 43d | 1 | 0.68mi |
| 843 N Knott St Portland, OR | 2.0 | 1.0 | 875 | $2,095 | $2.39 | 7d | 1 | 0.70mi |
| 4216 N Mississippi Ave #208 Portland, OR | 2.0 | 1.5 | 1167 | $2,950 | $2.53 | 24d | 1 | 0.70mi |
| 548 NE Tillamook St Unit 548 Portland, OR | 2.0 | 1.0 | 836 | $1,695 | $2.03 | 3d | 1 | 0.75mi |
| 2005 N Williams Ave Portland, OR | 2.0 | 1.0–2.0 | 776 | $2,180 | $2.81 | 2d | 8 | 0.77mi |
| 122 N Alberta St Portland, OR | 2.0 | 1.0 | 804 | $2,100 | $2.61 | 15d | 1 | 0.78mi |
| 4980 N Vancouver Ave Unit 1309893P Portland, OR | 4.0 | 2.0 | 1313 | $7,883 | $6.00 | 20d | 1 | 0.78mi |
| 231 NE Hancock St Unit A Portland, OR | 2.0 | 2.0 | 1330 | $3,200 | $2.41 | 44d | 1 | 0.78mi |
Listing history 2 events
-
2026-06-19remarks 699-char remark
-
2026-06-19$399,000 Active 1 DOM
ⓘ Source: listings_history table (triggers on properties + properties_extension) + one-shot
backfill from property_details.listing_events for pre-trigger history.
Tax reassessment forecast OR · Resets to sale price
- Current annual tax
- $6,618 · $552/mo
- Projected year-2 tax
- $6,618 · $552/mo
- Expected delta
- $0/yr ($0/mo · 0.0%)
ⓘ Screening estimate from a state-policy table — verify with the county assessor before closing.
Climate risk First Street
- Flood 1/10 Low FEMA zone X (unshaded) · 0% chance over 30 yrs
- Wildfire 1/10 Low
- Heat 3/10 Moderate 7 d/yr ≥92°F today · 14 d/yr by 30 yrs out
- Wind 1/10 Low
- Air quality 10/10 Extreme 19 unhealthy d/yr today · 20 by 30 yrs out
Nearby sold comps map
Loading sold comps map…
Walkable amenities ~0.75 mi
Loading nearby amenities…
Taxation est. · year 1
- Rental income
- $52,752
- − Mortgage interest
- −$22,350
- − Property taxes
- −$6,618
- − Insurance
- −$1,995
- − Repairs & maintenance
- −$4,220
- − Management
- −$4,220
- − Depreciation
- −$11,607
- Taxable income
- $1,741
- Est. tax owed @ 24.0%
- −$418
- After-tax cash flow
- $7,534/yr
For passive investors: Depreciation is non-cash, so a rental often shows a tax loss while cash-flowing — sheltering income. Rental losses are passive: they offset passive income freely, and up to $25,000/yr can offset ordinary (W-2) income if you actively participate and your MAGI is under $100k (phasing out to $0 by $150k); unused losses carry forward. On sale, claimed depreciation is recaptured at up to 25%, and gains may owe capital-gains tax (a 1031 exchange can defer both). Figures are a year-1 estimate at your 24.0% rate — not tax advice; consult a CPA.
Schools (NCES district)
- District
- Portland SD 1J
- NCES district ID
- 4110040
- Math proficiency
- 46% ▼ -2.00%
- Reading proficiency
- 58% ▼ -3.00%
- Median HH income
- $57,851
- Composite
- 47.1/100
- National rank
- #5112
- State rank
- #23 of 183 in OR
Livability — Portland
- Score
- 77/100
- State rank
- #72
- US rank
- #3256
Category grades
Schools grade is shown separately in the Schools card above.
Census & demographics
- Census place
- Portland, OR
- County
- Multnomah County · 786,692 people
- City population
- 774,334
- Metro
- Portland-Vancouver-Hillsboro, OR-WA
- Population (ZIP)
- 28,042
- Household income
- $131,932
- Rent vs Own
- Severe rent burden
- 1001.0
Population outlook (Multnomah County) Hauer SSP2
- Today (2025)
- 930,825 people
- By 2030
- 996,904 · +7.1%
- By 2040
- 1,121,379 · +20.5%
- By 2050
- 1,242,124 · +33.4%
- By 2075
- 1,464,431 · +57.3%
- By 2100
- 1,576,181 · +69.3%
Race, ethnicity, and origin ACS 2023
- Neighborhood character
- Predominantly White (76%)
- Race & ethnicity
- White 76% Two or more races 11% Hispanic / Latino 9% Black 6% Asian 3%
- Hispanic origin (detail)
- Mexican 5%
- Common ancestry
- Italian 4% Slovak 4% Lithuanian 3%
- Foreign-born
- 7% · Canada, China
- Languages at home
- 88% English-only · Spanish 5% Other Indo-European 2% French/Haitian/Cajun 1%
Political lean MEDSL · Multnomah
- 2024 margin
- Solid D (+62.1) · D 79.3% · R 17.2% · Other 3.5%
- 2008→2024 swing
- +6.0pp toward D · 2008: 56.1pp · 2024: 62.1pp
- All cycles
- 2024: D+62.1 2020: D+61.3 2016: D+58.3 2012: D+54.9 2008: D+56.1
Not yet ingested
- Civics
- —
Market trends
- HPI YoY
- ▼ -1048.78%
- Current HPI
- 312.3989
- Rent YoY
- ▲ 3.49%
- Metro
- Portland-Vancouver-Hillsboro, OR-WA
- State GDP YoY
- ▲ 2.05%
- F500 in state
- 2
Industry mix (Fortune 500 HQ in OR)
| Industry | F500 HQs | Revenue |
|---|---|---|
| Consumer Goods | 1 | $51B |
|
||
Price history
1 event — show timeline
- 2026-06-18 Listed $399,000 RMLS
Property tax history
+4.4%/yrLatest (2025): $6,618 · +3.7% YoY. Source: county tax records.
Cash-flow waterfall
monthlySold comps — $/sqft
last 12 mo · ≤1 miLoading sold comps…