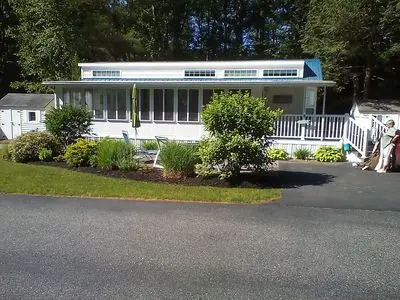
1 Ross Rd
Old Orchard Beach, ME 04064
$94,000B
3 bd · 1.0 ba ·
1,248 sqft ·
Built 1970
· Manufactured
· Active
· 15 DOM
Cashflow @ list (25.0% down · 7.5%)
Estimated rent
$2,541/mo
Mortgage (P&I)
−$493
Tax + insurance
−$253
HOA
−$0
Vac / Maint / Mgmt
−$534
Net cashflow
$1,262/mo
Annual
$15,140/yr
Cap rate
22.40%
Cash-on-cash
57.52%
DSCR
3.56
1% rule
2.70%
Cash to close
$26,320
Investor read
- This is a 3-bed/1.0-bath manufactured listed at $94k.
- At list price, monthly cash flow is $1k ($15k/yr) — positive.
- The deal already cash-flows at list — no discount required.
- Meets the 1% rule at list price ($3k rent vs $94k).
- It's been on market 15 days — a 2% lower offer ($93k) is reasonable based on typical stale-listing flexibility.
- Recommended offer: $93k (1.5% below list) — sets the bar for market timing.
- Local home prices are declining (-3.0%/yr); year-one equity from $650 of loan paydown is wiped out by about $3k of value loss. Plan a longer hold.
- Location reads 68/100 on livability (#88 in ME) — a middle-class / working-renter tenant base. Strengths: crime A+, housing A+, cost of living B+; Watch: schools D, amenities F, commute F.
- RSU 23 (suburban): math 78% / reading 80% proficiency, ranked #87 of 112 in ME (top 78%) — strong family-tenant draw, lease renewals of 3-5y typical.
- Watch-outs: property tax is 2.7% of price.
- Market conditions: Rents rising fast (+4.9%/yr); 171 active listings in the ZIP; 1 comparable units currently listed for rent nearby; 1,386 units permitted in York County in 2024 (338 in 5+ unit buildings).
- At projected returns (-3.0% appreciation + 4.9% rent growth), your $26k cash investment doubles in ~2 years — after that, you're playing with house money.
- Climate carrying-cost: major wind risk, 64% chance of damaging wind over 30y — expect insurance premiums to compound above CPI over the hold.
- Cap rate 22.4% vs local median 2.1% in Old Orchard Beach — top-decile yield for the area; either an underpriced asset or a hidden risk that comps aren't pricing in. Stress-test before assuming the spread holds.
- At $2,541/mo this rent would consume 51% of the median local household income ($60k/yr) (locally 441% of renters already pay >50% of income on rent) — very limited rent-growth headroom before tenants either downsize or default.
Questions for listing agent
- Built in 1970 — when were the roof, HVAC, electrical panel, plumbing, and water heater last replaced?
- Property tax is high relative to price — has the assessment been appealed recently, and will the sale trigger a re-assessment?
- Is there a deadline driving the sale (1031 exchange, divorce, estate, relocation)? That informs how much negotiation room exists.
- Schools are D-rated, which usually means shorter tenancies and higher turnover. Who's the typical renter profile here, and what's been the actual vacancy rate?
- What's the average days-on-market for RENTAL listings here right now (not sales)? A rising rental-DOM trend means longer vacancies and softer asking-rent achievability than the comps imply.
- What's the recent tenant-quality profile in this submarket — average credit score on applications, eviction rate, late-payment / NSF rate, and stable-employment percentage? A property-management company in the area should have these aggregated.
- How much new for-sale + rental construction is in the pipeline within 1–3 miles? Heavy new supply typically softens prices + rents 12–24 months out; constrained supply supports both.
CashFlowRE · CFR-WDN805ETCAYT02
· Data 3 weeks ago
cashflowre.app · 2026-05-29