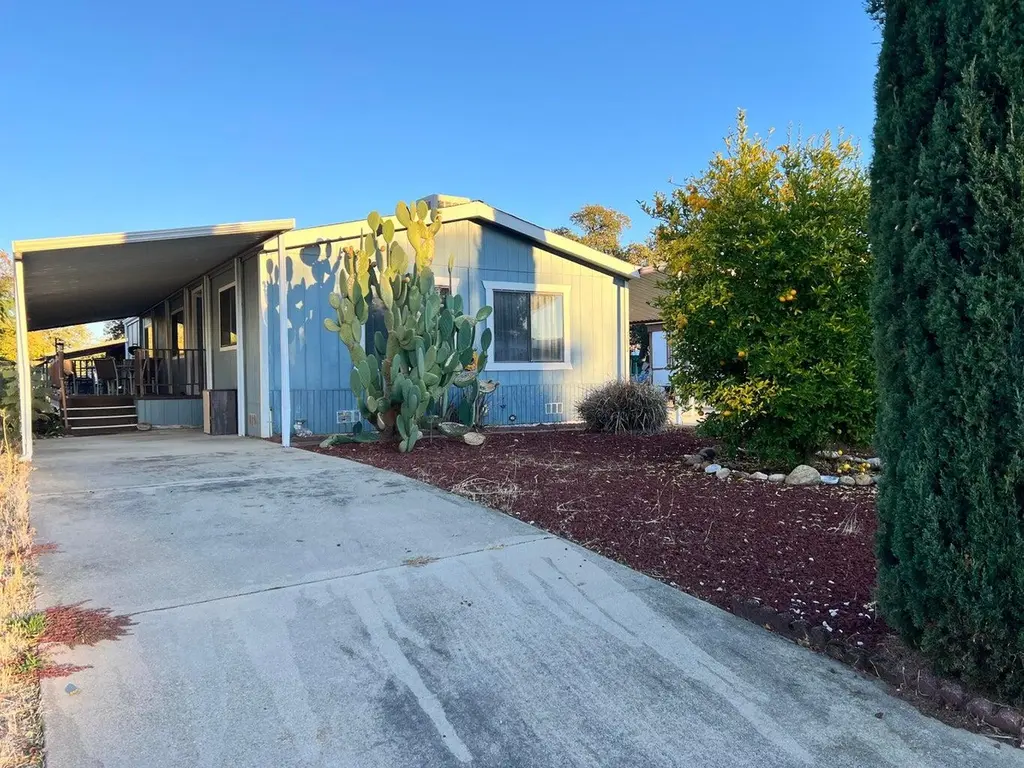
1071 Eagle Nest Rd
Redding, CA 96003
$159,000C-
2 bd · 2.0 ba ·
1,344 sqft ·
Built 1984
· Manufactured
· Active
· 22 DOM
Cashflow @ list (25.0% down · 7.5%)
Estimated rent
$1,606/mo
Mortgage (P&I)
−$834
Tax + insurance
−$199
HOA
−$75
Vac / Maint / Mgmt
−$337
Net cashflow
$162/mo
Annual
$1,939/yr
Cap rate
7.51%
Cash-on-cash
4.36%
DSCR
1.19
1% rule
1.01%
Cash to close
$44,520
Investor read
- This is a 2-bed/2.0-bath manufactured listed at $159k.
- At list price, monthly cash flow is $162 ($2k/yr) — positive.
- The deal already cash-flows at list — no discount required.
- Meets the 1% rule at list price ($2k rent vs $159k).
- It's been on market 22 days — a 2% lower offer ($157k) is reasonable based on typical stale-listing flexibility.
- Recommended offer: $157k (1.5% below list) — sets the bar for market timing.
- Local home prices are declining (-3.0%/yr); year-one equity from $1k of loan paydown is wiped out by about $5k of value loss. Plan a longer hold.
- Location reads 76/100 on livability (#106 in CA, #3,726 nationally) — a middle-class / working-renter tenant base. Strengths: amenities A+, commute A+, health & safety A+; Watch: employment C-, crime F, cost of living F.
- Gateway Unified (suburban): math 25% / reading 35% proficiency, ranked #355 of 517 in CA (top 69%) — families likely to look elsewhere, expect single-tenant / working-renter base with shorter leases.
- Market conditions: Rents rising fast (+6.0%/yr); 391 active listings in the ZIP; 12 comparable units currently listed for rent nearby; rentals at typical pace (median 22d on market — plan ~3-4 weeks tenant-placement turnaround); 246 units permitted in Shasta County in 2024 (0 in 5+ unit buildings).
- Shasta County population projected to shrink 9% by 2050 — rents likely to lag national; underwrite the cash flow, not the appreciation.
- 5 sale attempts since 10y ago with the ask held roughly flat each time — persistent listings suggest the price (not the market) is what's stuck; bring a comps-based counter.
- Climate carrying-cost: major wildfire risk; extreme-heat days projected 7→16/yr by 2055 (HVAC capex compounding) — expect insurance premiums to compound above CPI over the hold.
- Cap rate 7.5% vs local median 3.3% in Redding — top-decile yield for the area; either an underpriced asset or a hidden risk that comps aren't pricing in. Stress-test before assuming the spread holds.
Questions for listing agent
- What does the HOA fee cover, when was the last increase, and are there any pending special assessments or reserve-fund shortfalls?
- Is there a deadline driving the sale (1031 exchange, divorce, estate, relocation)? That informs how much negotiation room exists.
- Schools are B-rated — typically a magnet for longer-tenancy family renters. What's the average tenant stay here, and is there a school-zone premium baked into asking?
- Crime grade is F in this area — have there been break-ins, vandalism, or insurance claims at this property in the last 3 years? What carrier currently insures it and at what premium?
- What's the average days-on-market for RENTAL listings here right now (not sales)? A rising rental-DOM trend means longer vacancies and softer asking-rent achievability than the comps imply.
- What's the recent tenant-quality profile in this submarket — average credit score on applications, eviction rate, late-payment / NSF rate, and stable-employment percentage? A property-management company in the area should have these aggregated.
- How much new for-sale + rental construction is in the pipeline within 1–3 miles? Heavy new supply typically softens prices + rents 12–24 months out; constrained supply supports both.
CashFlowRE · CFR-WDNYPBD1E35ME0
· Data 2 days ago
cashflowre.app · 2026-05-29