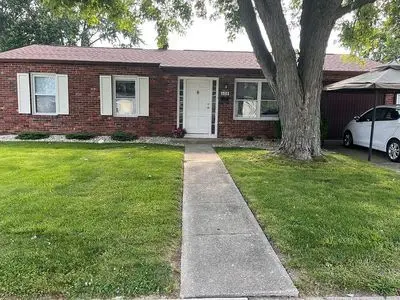
608 Willow Dr
Shelbyville, IN 46176
$192,500C-
4 bd · 1.0 ba ·
1,152 sqft ·
Built 1977
· SingleFamily
· Active
· 12 DOM
Cashflow @ list (25.0% down · 7.5%)
Estimated rent
$1,922/mo
Mortgage (P&I)
−$1,009
Tax + insurance
−$170
HOA
−$0
Vac / Maint / Mgmt
−$404
Net cashflow
$339/mo
Annual
$4,067/yr
Cap rate
8.41%
Cash-on-cash
7.54%
DSCR
1.34
1% rule
1.00%
Cash to close
$53,900
Investor read
- This is a 4-bed/1.0-bath single-family listed at $192k.
- At list price, monthly cash flow is $339 ($4k/yr) — positive.
- The deal already cash-flows at list — no discount required.
- To meet the 1% rule (rent ≥ 1% of price), the offer needs to be $192k (0.1% below list).
- Only 12 days on market — expect competitive offers; lowballing is unlikely to land.
- Recommended offer: $192k (0.1% below list) — sets the bar for 1% rule.
- Local home prices are declining (-3.0%/yr); year-one equity from $1k of loan paydown is wiped out by about $6k of value loss. Plan a longer hold.
- Location reads 63/100 on livability (#450 in IN) — a middle-class / working-renter tenant base. Strengths: cost of living A+, housing A+, crime B; Watch: employment C-, schools D+, amenities F.
- Shelbyville Central Schools (town): math 40% / reading 39% proficiency, ranked #148 of 301 in IN (top 49%) — families likely to look elsewhere, expect single-tenant / working-renter base with shorter leases.
- Market conditions: 238 active listings in the ZIP; 2 comparable units currently listed for rent nearby; 285 units permitted in Shelby County in 2024 (147 in 5+ unit buildings).
- Shelby County population projected to shrink 6% by 2050 — rents likely to lag national; underwrite the cash flow, not the appreciation.
- 2 sale attempts since 4y ago with the ask held roughly flat each time — persistent listings suggest the price (not the market) is what's stuck; bring a comps-based counter.
- Current owner paid $120k; list at $192k implies a 60% gain — meaningful room to come down on a strong offer.
- Cap rate 8.4% vs local median 4.3% in Shelbyville — top-decile yield for the area; either an underpriced asset or a hidden risk that comps aren't pricing in. Stress-test before assuming the spread holds.
- This rent runs 35% of the median local income ($65k/yr) — at the standard rent-burdened threshold; future hikes will face affordability resistance.
Questions for listing agent
- Built in 1977 — when were the roof, HVAC, electrical panel, plumbing, and water heater last replaced?
- Is there a deadline driving the sale (1031 exchange, divorce, estate, relocation)? That informs how much negotiation room exists.
- Schools are D-rated, which usually means shorter tenancies and higher turnover. Who's the typical renter profile here, and what's been the actual vacancy rate?
- What's the average days-on-market for RENTAL listings here right now (not sales)? A rising rental-DOM trend means longer vacancies and softer asking-rent achievability than the comps imply.
- What's the recent tenant-quality profile in this submarket — average credit score on applications, eviction rate, late-payment / NSF rate, and stable-employment percentage? A property-management company in the area should have these aggregated.
- How much new for-sale + rental construction is in the pipeline within 1–3 miles? Heavy new supply typically softens prices + rents 12–24 months out; constrained supply supports both.
CashFlowRE · CFR-WDXW6RAB7DXHEK
· Data 2 h ago
cashflowre.app · 2026-05-29