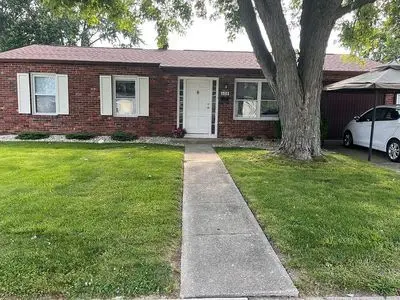
608 Willow Dr · Shelbyville, IN
Flood risk 1/10 · Minimal
- FEMA flood zone
- X (unshaded)
- Chance of flooding over 30 yrs
- 0.0%
- Est. flood insurance / yr
- $507 – $1,088
Fire risk 1/10 · Minimal
- Est. fire insurance / yr
- $717 – $1,331
Heat risk 3/10 · Minor
- Hot days now (above 103°F)
- 7 days/yr
- Hot days in 30 yrs
- 19 days/yr
Wind risk 2/10 · Minimal
- Chance of severe wind over 30 yrs
- 1.0%
Air-quality risk 2/10 · Minimal
- Unhealthy air days now
- 1 days/yr
- Unhealthy air days in 30 yrs
- 2 days/yr
Risk factors via First Street. Map © Google.
Why this score? — see what drove the C- grade
The composite is a weighted blend of 9 inputs, each scored 0–100. Each bar is that input's sub-score; the figure is the points it added to the 100-point composite (weight × sub-score).
- Cash flow +22.9/30.0
- DSCR +7.4/10.0
- ARV discount +6.9/15.0
- 1% rule +5.0/10.0
- Schools +3.4/10.0
- Livability +3.2/5.0
- Rent growth +2.5/5.0
- Condition / age +2.5/5.0
- Appreciation +0.0/10.0
$192,500
🖨 Deal sheet (PDF) 📄 Offer letter ✓ Due diligence
Listing remarks MLS
Very nice 4 bedroom 1 bath house in Wellington Heights neighborhood is now available! Move in ready. New paint, flooring, light fixtures and roof. This one won't last long at this price point. Schedule a showing today!
Key facts
- New flooring
- New paint
- New light fixtures
Tags
Neighborhood map
What this means for you Summary
Snapshot
- This is a 4-bed/1.0-bath single-family listed at $192k.
Deal economics
- At list price, monthly cash flow is $339 ($4k/yr) — positive.
- The deal already cash-flows at list — no discount required.
- To meet the 1% rule (rent ≥ 1% of price), the offer needs to be $192k (0.1% below list).
- Recommended offer: $192k (0.1% below list) — sets the bar for 1% rule.
- Cap rate 8.4% vs local median 4.3% in Shelbyville — top-decile yield for the area; either an underpriced asset or a hidden risk that comps aren't pricing in. Stress-test before assuming the spread holds.
Location & tenants
- Location reads 63/100 on livability (#450 in IN) — a middle-class / working-renter tenant base. Strengths: cost of living A+, housing A+, crime B; Watch: employment C-, schools D+, amenities F.
- Shelbyville Central Schools (town): math 40% / reading 39% proficiency, ranked #148 of 301 in IN (top 49%) — families likely to look elsewhere, expect single-tenant / working-renter base with shorter leases.
- Market conditions: 229 active listings in the ZIP; 2 comparable units currently listed for rent nearby; 285 units permitted in Shelby County in 2024 (147 in 5+ unit buildings).
- This rent runs 35% of the median local income ($65k/yr) — at the standard rent-burdened threshold; future hikes will face affordability resistance.
Forward outlook
- Local home prices are declining (-3.0%/yr); year-one equity from $1k of loan paydown is wiped out by about $6k of value loss. Plan a longer hold.
- Shelby County population projected to shrink 6% by 2050 — rents likely to lag national; underwrite the cash flow, not the appreciation.
Negotiation context
- Only 9 days on market — expect competitive offers; lowballing is unlikely to land.
- 2 sale attempts since 4y ago with the ask held roughly flat each time — persistent listings suggest the price (not the market) is what's stuck; bring a comps-based counter.
- Current owner paid $120k; list at $192k implies a 60% gain — meaningful room to come down on a strong offer.
Questions for the listing agent
- Built in 1977 — when were the roof, HVAC, electrical panel, plumbing, and water heater last replaced?
- Is there a deadline driving the sale (1031 exchange, divorce, estate, relocation)? That informs how much negotiation room exists.
- Schools are D-rated, which usually means shorter tenancies and higher turnover. Who's the typical renter profile here, and what's been the actual vacancy rate?
- What's the average days-on-market for RENTAL listings here right now (not sales)? A rising rental-DOM trend means longer vacancies and softer asking-rent achievability than the comps imply.
- What's the recent tenant-quality profile in this submarket — average credit score on applications, eviction rate, late-payment / NSF rate, and stable-employment percentage? A property-management company in the area should have these aggregated.
- How much new for-sale + rental construction is in the pipeline within 1–3 miles? Heavy new supply typically softens prices + rents 12–24 months out; constrained supply supports both.
Investment metrics
- 1% rule
- 1.00% ✗
- Cap rate
- 8.41%
- Cash-on-cash
- 7.54%
- DSCR
- 1.34
- GRM
- 8.3
CMA / ARV
- ARV (on-the-fly)
- $190,080
- Comps found
- 12
Show comp detail 12 sales within ~0.75 mi
| Address | Dist | Beds/Ba | Sqft | Sold | Price | $/sf | Match |
|---|---|---|---|---|---|---|---|
| 822 Berkeley | 0.16mi | 3/1.0 (-1) | 1,164 (+1%) | 0mo | $127,000 | $109 | 85 |
| 904 Hemlock St | 0.20mi | 3/1.5 (-1) | 1,160 (+1%) | 0mo | $217,000 | $187 | 82 |
| 609 Willow Dr | 0.03mi | 4/1.0 | 1,056 (-8%) | 8mo | $165,000 | $156 | 78 |
| 729 Berkeley Dr | 0.14mi | 3/1.0 (-1) | 1,229 (+7%) | 2mo | $199,000 | $162 | 75 |
| 513 Willow Dr | 0.10mi | 3/1.0 (-1) | 1,032 (-10%) | 3mo | $179,900 | $174 | 70 |
| 1073 Fuller Ln | 0.12mi | 3/2.0 (-1) | 1,294 (+12%) | 3mo | $232,000 | $179 | 62 |
| 319 Roosevelt Dr | 0.33mi | 4/1.0 | 1,296 (+12%) | 4mo | $135,000 | $104 | 61 |
| 407 Eberhart Dr | 0.29mi | 3/1.0 (-1) | 984 (-15%) | 1mo | $194,900 | $198 | 57 |
| 529 Eastern Ave | 0.34mi | 3/1.0 (-1) | 1,260 (+9%) | 10mo | $80,000 | $63 | 55 |
| 911 Congressional Way | 0.68mi | 3/2.0 (-1) | 1,200 (+4%) | 2mo | $198,000 | $165 | 51 |
| 912 Delegate Dr | 0.58mi | 3/2.0 (-1) | 1,240 (+8%) | 8mo | $225,000 | $181 | 44 |
| 116 E South St | 0.73mi | 4/2.0 | 1,276 (+11%) | 1mo | $169,500 | $133 | 43 |
Match score weights: distance 35% · size 25% · config 20% · recency 20%. Top-matched comps best support the ARV.
Projected returns pro-forma
-3.0% appreciation · 3.0% rent growth · sell at horizon
- IRR
- -4.8%
- Equity multiple
- 0.82×
- Total profit
- $-9,672
- Equity at exit
- $28,702
- IRR
- 4.8%
- Equity multiple
- 1.35×
- Total profit
- $19,113
- Equity at exit
- $16,644
Cash invested: $53,900 (down + closing). Projections, not guarantees.
Landlord ↔ Tenant lean methodology
- Overall (STATE)
- 90 Strongly Landlord-Friendly
- State Indiana
- 90 Strongly Landlord-Friendly · R+11
- County
- — inherits STATE
- City
- — inherits STATE
ZIP-level market 46176
- Home prices YoY
- -33.9%
- Active inventory
- 229
- Price-to-rent
- 8.3×
Monthly cashflow live
- Estimated rent
- $1,922 medium interval (Pro) →
- Mortgage (P&I)
- −$1,009
- Tax from tax record
- −$90 /mo · $1,082/yr
- Insurance
- −$80
- HOA
- −$0
- Vacancy / Maint / Mgmt
- −$404
- Net cashflow
- $339
Break-even live
Sensitivity live
| Price | -10% $448 | -5% $393 | +0% $339 | +5% $284 | +10% $230 |
|---|---|---|---|---|---|
| Rent | -10% $187 | -5% $263 | +0% $339 | +5% $415 | +10% $491 |
| Rate | -1.0pp $436 | -0.5pp $388 | base $339 | +0.5pp $289 | +1.0pp $238 |
UW: 25.0% down · 7.5% · 30yr · 1.5% tax · 5.0% vac · 8.0% maint · 8.0% mgmt
Financing live
Cash to close
- Down payment
- $48,125
- Closing costs
- $5,775
- Reserves months
- —
- Total cash needed
- —
Loan-product check · same deal, 3 products live
Conventional
25% down · 7.5% · 30yr
- Down + closing
- —
- Monthly P&I
- —
- Monthly cashflow
- —
- DSCR
- —
- Eligible?
- —
Personal DTI + credit; lowest rate.
DSCR
20% down · 8.5% · 30yr
- Down + closing
- —
- Monthly P&I
- —
- Monthly cashflow
- —
- DSCR
- —
- Eligible?
- —
No personal income docs; deal must DSCR.
Hard money
10% down · 12.0% · 12mo
- Down + closing
- —
- Monthly P&I
- —
- Monthly cashflow
- —
- DSCR
- —
- Eligible?
- —
Short-term bridge; refi at stabilization.
Rent comps 2 comps
| Address | Beds | Baths | Sqft | Rent | $/sqft | DOM | Units | Dist |
|---|---|---|---|---|---|---|---|---|
| 1021 Amos Rd Shelbyville, IN | 3.0 | 1.5 | 1476 | $1,635 | $1.11 | 8d | 1 | 0.28mi |
| 425 N Harrison St Shelbyville, IN | 3.0 | 1.0–2.0 | 909 | $1,882 | $2.07 | 2d | 7 | 1.10mi |
Listing history 8 events
-
2026-06-18days on market $192,500 Active 9 DOM
-
2026-06-17pricedays on market $192,500 Active 8 DOM
-
2026-06-16days on market $200,000 Active 7 DOM
-
2026-06-15days on market $200,000 Active 6 DOM
-
2026-06-13days on market $200,000 Active 4 DOM
-
2026-06-13days on market $200,000 Active 3 DOM
-
2026-06-10remarks 225-char remark
-
2026-06-10$200,000 Active 1 DOM
ⓘ Source: listings_history table (triggers on properties + properties_extension) + one-shot
backfill from property_details.listing_events for pre-trigger history.
Tax reassessment forecast IN · Partial reset (capped growth)
- Current annual tax
- $1,082 · $90/mo
- Projected year-2 tax
- $1,359 · $113/mo
- Expected delta
- +$277/yr (+$23/mo · 25.6%)
ⓘ Screening estimate from a state-policy table — verify with the county assessor before closing.
Climate risk First Street
- Flood 1/10 Low FEMA zone X (unshaded) · 0% chance over 30 yrs
- Wildfire 1/10 Low
- Heat 3/10 Moderate 7 d/yr ≥103°F today · 19 d/yr by 30 yrs out
- Wind 2/10 Low 100% chance of damaging wind over 30 yrs
- Air quality 2/10 Low 1 unhealthy d/yr today · 2 by 30 yrs out
Nearby sold comps map
Loading sold comps map…
Walkable amenities ~0.75 mi
Loading nearby amenities…
Taxation est. · year 1
- Rental income
- $23,070
- − Mortgage interest
- −$10,783
- − Property taxes
- −$1,082
- − Insurance
- −$962
- − Repairs & maintenance
- −$1,846
- − Management
- −$1,846
- − Depreciation
- −$5,600
- Taxable income
- $951
- Est. tax owed @ 24.0%
- −$228
- After-tax cash flow
- $3,838/yr
For passive investors: Depreciation is non-cash, so a rental often shows a tax loss while cash-flowing — sheltering income. Rental losses are passive: they offset passive income freely, and up to $25,000/yr can offset ordinary (W-2) income if you actively participate and your MAGI is under $100k (phasing out to $0 by $150k); unused losses carry forward. On sale, claimed depreciation is recaptured at up to 25%, and gains may owe capital-gains tax (a 1031 exchange can defer both). Figures are a year-1 estimate at your 24.0% rate — not tax advice; consult a CPA.
Schools (NCES district)
- District
- Shelbyville Central Schools
- NCES district ID
- 1810140
- Math proficiency
- 40% ▼ -10.00%
- Reading proficiency
- 39% ▼ -9.00%
- Median HH income
- $45,199
- Composite
- 33.63/100
- National rank
- #5402
- State rank
- #148 of 301 in IN
Livability — Shelbyville
- Score
- 63/100
- State rank
- #450
- US rank
- #16051
Category grades
Schools grade is shown separately in the Schools card above.
Census & demographics
- Census place
- Shelbyville, IN
- County
- Shelby County · 28,782 people
- City population
- 28,782
- Metro
- Indianapolis-Carmel-Anderson, IN
- Population (ZIP)
- 28,782
- Household income
- $65,182
- Rent vs Own
- Severe rent burden
- 921.0
Population outlook (Shelby County) Hauer SSP2
- Today (2025)
- 45,020 people
- By 2030
- 44,962 · -0.1%
- By 2040
- 44,126 · -2.0%
- By 2050
- 42,110 · -6.5%
- By 2075
- 37,131 · -17.5%
- By 2100
- 29,714 · -34.0%
Race, ethnicity, and origin ACS 2023
- Neighborhood character
- Predominantly White (88%)
- Race & ethnicity
- White 88% Hispanic / Latino 7% Two or more races 4% Black 2% Asian 1%
- Hispanic origin (detail)
- Mexican 5%
- Common ancestry
- Italian 2% Slovak 1% Lithuanian 1%
- Foreign-born
- 5% · Canada
- Languages at home
- 92% English-only · Spanish 5% German/W. Germanic 1% Other Asian/Pacific 1%
Political lean MEDSL · Shelby
- 2024 margin
- Solid R (+48.0) · D 25.1% · R 73.1% · Other 1.8%
- 2008→2024 swing
- -29.0pp toward R · 2008: -19.0pp · 2024: -48.0pp
- All cycles
- 2024: R+48.0 2020: R+47.7 2016: R+47.2 2012: R+33.5 2008: R+19.0
Not yet ingested
- Civics
- —
Market trends
- HPI YoY
- ▼ -116.59%
- Current HPI
- 227.6747
- Rent YoY
- —
- Metro
- Indianapolis-Carmel-Anderson, IN
- State GDP YoY
- ▲ 2.90%
- F500 in state
- 18
Industry mix (Fortune 500 HQ in IN)
| Industry | F500 HQs | Revenue |
|---|---|---|
| Industrial Machinery | 2 | $37B |
|
||
| Healthcare | 1 | $177B |
|
||
| Pharmaceuticals | 1 | $45B |
|
||
| Metals / Steel | 1 | $18B |
|
||
| Agriculture | 1 | $17B |
|
||
| Packaging | 1 | $12B |
|
||
Price history
+33.3% since first listed4 events — show timeline
- 2026-06-10 Listed $200,000 FSBO.com
- 2022-03-24 Sold (MLS) $120,000 MIBOR as Distributed by MLS Grid
- 2022-03-04 Pending — MIBOR as Distributed by MLS Grid
- 2022-02-25 Listed $150,000 MIBOR as Distributed by MLS Grid
Property tax history
-1.0%/yrLatest (2025): $1,082 · -7.8% YoY. Source: county tax records.
Cash-flow waterfall
monthlySold comps — $/sqft
last 12 mo · ≤1 miLoading sold comps…