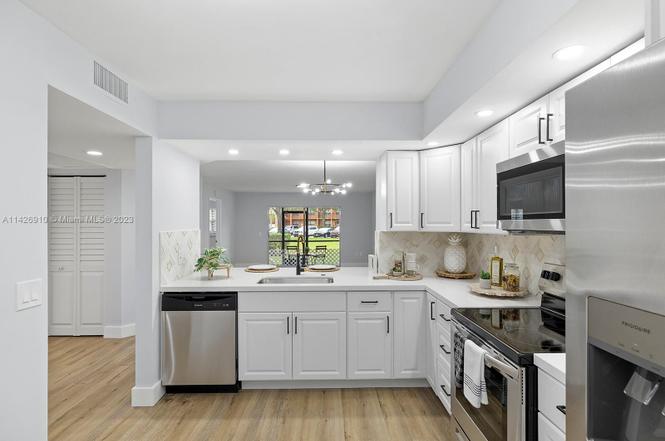
701 SW 142nd Ave Unit 108S
Pembroke Pines, FL 33027
$260,000D-
2 bd · 2.0 ba ·
1,207 sqft ·
Built 1998
· Condo
· Active
· 155 DOM
Cashflow @ list (25.0% down · 7.5%)
Estimated rent
$2,435/mo
Mortgage (P&I)
−$1,363
Tax + insurance
−$370
HOA
−$472
Vac / Maint / Mgmt
−$511
Net cashflow
$-282/mo
Annual
$-3,384/yr
Cap rate
4.99%
Cash-on-cash
-4.65%
DSCR
0.79
1% rule
0.94%
Cash to close
$72,800
Investor read
- This is a 2-bed/2.0-bath condo listed at $260k.
- At list price, monthly cash flow is $-282 ($-3k/yr) — negative.
- To cash-flow at today's rent, offer at most $210k (19.2% below list).
- To meet the 1% rule (rent ≥ 1% of price), the offer needs to be $244k (6.3% below list).
- It's been on market 155 days — a 12% lower offer ($229k) is reasonable based on typical stale-listing flexibility.
- Recommended offer: $210k (19.2% below list) — sets the bar for cash-flow.
- Local home prices are declining (-2.0%/yr); year-one equity from $2k of loan paydown is wiped out by about $5k of value loss. Plan a longer hold.
- Location reads 83/100 on livability (#54 in FL, #933 nationally) — a professional / high-income tenant draw. Strengths: housing A+, health & safety A+, schools A-; Watch: amenities D+, cost of living D+.
- Broward (suburban): math 42% / reading 53% proficiency, ranked #46 of 73 in FL (top 63%) — families likely to look elsewhere, expect single-tenant / working-renter base with shorter leases.
- Market conditions: Rents soft (-0.2%/yr); 543 active listings in the ZIP; 40 comparable units currently listed for rent nearby; rentals at typical pace (median 21d on market — plan ~3-4 weeks tenant-placement turnaround); solid renter incomes; 2,111 units permitted in Broward County in 2024 (1,265 in 5+ unit buildings).
- Broward County population projected at +34% by 2050 — long-run rental-demand tailwind backs the buy-and-hold thesis.
- 6 sale attempts since 3y ago; this cycle's ask has dropped $35k (12%) from the opening price — seller is motivated, your offer sets the floor, not the list.
- Climate carrying-cost: severe wind risk, 99% chance of damaging wind over 30y; extreme-heat days projected 7→26/yr by 2055 (HVAC capex compounding) — expect insurance premiums to compound above CPI over the hold.
- Cap rate 5.0% vs local median 4.0% in Pembroke Pines — meaningfully above typical; check what's discounted (condition, days-on-market, listing class) to confirm the premium yield is real.
- This rent runs 38% of the median local income ($77k/yr) — at the standard rent-burdened threshold; future hikes will face affordability resistance.
Questions for listing agent
- What do current leases actually rent for vs. the listed asking? Can we see a recent rent roll and the last 12 months of T-12 income?
- It's been on market 155 days. Have you received any prior offers? Is the seller open to a 19% concession, seller financing, or rate buy-down credit?
- What does the HOA fee cover, when was the last increase, and are there any pending special assessments or reserve-fund shortfalls?
- Any open or pending special assessments — roof, HVAC, plumbing, elevator, façade? What's the per-unit balance and payoff schedule, and is the seller paying it off at close or rolling it to the buyer?
- Why hasn't it sold? Are there any deal-killer items the seller is aware of (foundation, flood, title, zoning, code violations)?
- Is there a deadline driving the sale (1031 exchange, divorce, estate, relocation)? That informs how much negotiation room exists.
- Schools are A-rated — typically a magnet for longer-tenancy family renters. What's the average tenant stay here, and is there a school-zone premium baked into asking?
- The area grade is low — what's the realistic commute time and amenity access for the typical tenant pool here? Any planned neighborhood developments (good or bad) we should know about?
CashFlowRE · CFR-WFBSP86TMA4X6R
· Data 2 days ago
cashflowre.app · 2026-05-29