701 SW 142nd Ave Unit 108S · Pembroke Pines, FL
Flood risk 1/10 · Minimal
- FEMA flood zone
- X (unshaded)
- Chance of flooding over 30 yrs
- 0.0%
- Est. flood insurance / yr
- $507 – $1,088
Fire risk 1/10 · Minimal
- Est. fire insurance / yr
- $947 – $1,759
Heat risk 10/10 · Severe
- Hot days now (above 106°F)
- 7 days/yr
- Hot days in 30 yrs
- 26 days/yr
Wind risk 10/10 · Severe
- Chance of severe wind over 30 yrs
- 99.0%
Air-quality risk 2/10 · Minimal
- Unhealthy air days now
- 2 days/yr
- Unhealthy air days in 30 yrs
- 2 days/yr
Risk factors via First Street. Map © Google.
Why this score? — see what drove the D- grade
The composite is a weighted blend of 9 inputs, each scored 0–100. Each bar is that input's sub-score; the figure is the points it added to the 100-point composite (weight × sub-score).
- Cash flow +7.9/30.0
- ARV discount +7.5/15.0
- 1% rule +4.4/10.0
- Livability +4.2/5.0
- Schools +4.1/10.0
- Appreciation +4.0/10.0
- Rent growth +2.5/5.0
- Condition / age +2.5/5.0
- DSCR +1.9/10.0
$260,000
🖨 Deal sheet 📄 Offer letter ✓ Due diligence
Listing remarks
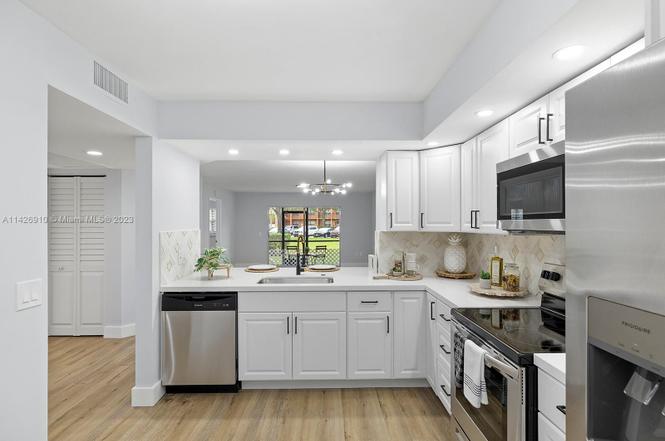
Rarely Available Remodeled 2BR/2BA First-Floor Condo – 1,200+ Sq Ft in Century Village! Spacious and beautifully remodeled 2 bedroom, 2 bathroom first-floor unit with over 1,200 sq ft of living space and an open layout. Enjoy a stunning modern kitchen and comfortable living in this rarely available condo located in Century Village, a premier 55+ community offering resort-style amenities: clubhouse, pools, fitness center, golf, tennis, shuttle service, and more. Conveniently located near major highways, shopping, and dining. Luxury 55+ living at its finest – don’t miss out! * * * * VACANT AND Easy to Show * * * * Motivated Seller * * * *
Key facts
- Fitness center
- Clubhouse
- Remodeled kitchen
Tags
Property features AI
Finance
- Financial info: Pets allowed with restrictions
- HOA & community: Monthly association dues; Association fees include management, amenities, common areas, cable TV, internet, grounds and structure maintenance, pools, recreation facilities, reserves, sewer, security, trash and water; Community amenities include clubhouse, fitness center, hobby room, pickleball, pool, putting greens, spa/hot tub, tennis courts, trails, transportation service and elevators; Senior community
Exterior
- Parking: Assigned parking; Guest parking; Two or more parking spaces
- Security: Complex fenced; Security guard
- Utilities: Water and sewer included in association; Cable TV and internet included in association
- Home design: Attached property; 4-story building; Entry on level 1; Updated / Remodeled
- Construction: Block construction; Effective year built
- Exterior features: Courtyard; Enclosed porch; Porch (screened); Tennis courts; Association pool
Interior
- Kitchen: Dishwasher; Electric range; Self-cleaning oven; Microwave; Garbage disposal; Refrigerator
- Bedrooms: Primary bedroom located on the main level
- Flooring: Ceramic tile; Tile; Vinyl
- Bathrooms: 2 full bathrooms
- Heating & cooling: Central heating; Central air conditioning
- Interior features: Breakfast bar; Breakfast area / Eat-in kitchen; Family/Dining room; Living/Dining room; First-floor entry; Main level primary bedroom; Bedroom on main level; Tub with shower; Walk-in closets
- Laundry & utility: Washer; Dryer; Unfurnished
Neighborhood map
What this means for you Summary
Snapshot
- This is a 2-bed/2.0-bath condo listed at $260k.
Deal economics
- At list price, monthly cash flow is $-282 ($-3k/yr) — negative.
- To cash-flow at today's rent, offer at most $210k (19.2% below list).
- To meet the 1% rule (rent ≥ 1% of price), the offer needs to be $244k (6.3% below list).
- Recommended offer: $210k (19.2% below list) — sets the bar for cash-flow.
- Cap rate 5.0% vs local median 4.0% in Pembroke Pines — meaningfully above typical; check what's discounted (condition, days-on-market, listing class) to confirm the premium yield is real.
Location & tenants
- Location reads 83/100 on livability (#54 in FL, #933 nationally) — a professional / high-income tenant draw. Strengths: housing A+, health & safety A+, schools A-; Watch: amenities D+, cost of living D+.
- Broward (suburban): math 42% / reading 53% proficiency, ranked #46 of 73 in FL (top 63%) — families likely to look elsewhere, expect single-tenant / working-renter base with shorter leases.
- Market conditions: Rents soft (-0.2%/yr); 543 active listings in the ZIP; 40 comparable units currently listed for rent nearby; rentals at typical pace (median 21d on market — plan ~3-4 weeks tenant-placement turnaround); solid renter incomes; 2,111 units permitted in Broward County in 2024 (1,265 in 5+ unit buildings).
- This rent runs 38% of the median local income ($77k/yr) — at the standard rent-burdened threshold; future hikes will face affordability resistance.
Forward outlook
- Local home prices are declining (-2.0%/yr); year-one equity from $2k of loan paydown is wiped out by about $5k of value loss. Plan a longer hold.
- Broward County population projected at +34% by 2050 — long-run rental-demand tailwind backs the buy-and-hold thesis.
Negotiation context
- It's been on market 155 days — a 12% lower offer ($229k) is reasonable based on typical stale-listing flexibility.
- 6 sale attempts since 3y ago; this cycle's ask has dropped $35k (12%) from the opening price — seller is motivated, your offer sets the floor, not the list.
Risks & watch-outs
- Climate carrying-cost: severe wind risk, 99% chance of damaging wind over 30y; extreme-heat days projected 7→26/yr by 2055 (HVAC capex compounding) — expect insurance premiums to compound above CPI over the hold.
Questions for the listing agent
- What do current leases actually rent for vs. the listed asking? Can we see a recent rent roll and the last 12 months of T-12 income?
- It's been on market 155 days. Have you received any prior offers? Is the seller open to a 19% concession, seller financing, or rate buy-down credit?
- What does the HOA fee cover, when was the last increase, and are there any pending special assessments or reserve-fund shortfalls?
- Any open or pending special assessments — roof, HVAC, plumbing, elevator, façade? What's the per-unit balance and payoff schedule, and is the seller paying it off at close or rolling it to the buyer?
- Why hasn't it sold? Are there any deal-killer items the seller is aware of (foundation, flood, title, zoning, code violations)?
- Is there a deadline driving the sale (1031 exchange, divorce, estate, relocation)? That informs how much negotiation room exists.
- Schools are A-rated — typically a magnet for longer-tenancy family renters. What's the average tenant stay here, and is there a school-zone premium baked into asking?
- The area grade is low — what's the realistic commute time and amenity access for the typical tenant pool here? Any planned neighborhood developments (good or bad) we should know about?
- What's the average days-on-market for RENTAL listings here right now (not sales)? A rising rental-DOM trend means longer vacancies and softer asking-rent achievability than the comps imply.
- What's the recent tenant-quality profile in this submarket — average credit score on applications, eviction rate, late-payment / NSF rate, and stable-employment percentage? A property-management company in the area should have these aggregated.
- How much new apartment / multifamily construction is in the pipeline within 1–3 miles? Heavy new supply (>2% of stock underway) typically softens rents 12–24 months out; light construction supports rent growth.
Investment metrics
- 1% rule
- 0.94% ✗
- Cap rate
- 4.99%
- Cash-on-cash
- -4.65%
- DSCR
- 0.79
- GRM
- 8.9
CMA / ARV
No comps found within radius.
Projected returns pro-forma
-2.01% appreciation · 0.0% rent growth · sell at horizon
- IRR
- -20.6%
- Equity multiple
- 0.23×
- Total profit
- $-56,055
- Equity at exit
- $50,346
- IRR
- -20.2%
- Equity multiple
- -0.22×
- Total profit
- $-88,647
- Equity at exit
- $42,883
Cash invested: $72,800 (down + closing). Projections, not guarantees.
Landlord ↔ Tenant lean methodology
- Overall (STATE)
- 87 Strongly Landlord-Friendly
- State Florida
- 87 Strongly Landlord-Friendly · R+3
- County
- — inherits STATE
- City
- — inherits STATE
ZIP-level market 33027
- Home prices YoY
- -0.6%
- Rents YoY
- -0.2%
- Active inventory
- 543
- Price-to-rent
- 8.9×
Monthly cashflow live
- Estimated rent
- $2,435 high interval (Pro) →
- Mortgage (P&I)
- −$1,363
- Tax from tax record
- −$262 /mo · $3,144/yr
- Insurance
- −$108
- HOA
- −$472
- Vacancy / Maint / Mgmt
- −$511
- Net cashflow
- $-282
Break-even live
UW: 25.0% down · 7.5% · 30yr · 1.5% tax · 5.0% vac · 8.0% maint · 8.0% mgmt
Financing live
Cash to close
- Down payment
- $65,000
- Closing costs
- $7,800
- Reserves months
- —
- Total cash needed
- —
Loan-product check · same deal, 3 products live
Conventional
25% down · 7.5% · 30yr
- Down + closing
- —
- Monthly P&I
- —
- Monthly cashflow
- —
- DSCR
- —
- Eligible?
- —
Personal DTI + credit; lowest rate.
DSCR
20% down · 8.5% · 30yr
- Down + closing
- —
- Monthly P&I
- —
- Monthly cashflow
- —
- DSCR
- —
- Eligible?
- —
No personal income docs; deal must DSCR.
Hard money
10% down · 12.0% · 12mo
- Down + closing
- —
- Monthly P&I
- —
- Monthly cashflow
- —
- DSCR
- —
- Eligible?
- —
Short-term bridge; refi at stabilization.
Rent comps 40 comps
| Address | Beds | Baths | Sqft | Rent | $/sqft | DOM | Units | Dist |
|---|---|---|---|---|---|---|---|---|
| 701 SW 141st Ave Unit 110R Pembroke Pines, FL | 2.0 | 1.5 | 1032 | $2,200 | $2.13 | 24d | 1 | 0.05mi |
| 701 SW 141st Ave Unit 405R Pembroke Pines, FL | 2.0 | 1.5 | 1032 | $2,000 | $1.94 | 24d | 1 | 0.05mi |
| 701 SW 141st Ave Unit 110R Pembroke Pines, FL | 2.0 | 1.5 | 1032 | $2,200 | $2.13 | 7d | 1 | 0.05mi |
| 943 SW 143rd Ter #2109 Pembroke Pines, FL | 3.0 | 2.5 | 1390 | $3,050 | $2.19 | 20d | 1 | 0.08mi |
| 962 SW 143rd Ave #2207 Pembroke Pines, FL | 3.0 | 2.5 | 1390 | $3,000 | $2.16 | 7d | 1 | 0.10mi |
| 962 SW 143rd Ave #2207 Pembroke Pines, FL | 3.0 | 2.5 | 1390 | $3,000 | $2.16 | 24d | 1 | 0.10mi |
| 915 SW 143rd Ave #2008 Pembroke Pines, FL | 2.0 | 2.5 | 1100 | $2,400 | $2.18 | 2d | 1 | 0.11mi |
| 1009 SW 144th Ave #2701 Pembroke Pines, FL | 3.0 | 2.5 | 1396 | $2,850 | $2.04 | 24d | 1 | 0.14mi |
| 850 SW 138th Ave Pembroke Pines, FL | 1.0–2.0 | 1.5–2.0 | 1120 | $2,250 | $2.01 | 22d | 2 | 0.15mi |
| 1062 SW 143rd Ave Pembroke Pines, FL | 3.0 | 2.5 | 1425 | $3,000 | $2.11 | 24d | 1 | 0.15mi |
| 500 SW 145th Ave Pembroke Pines, FL | 1.0–3.0 | 1.0–2.0 | 1044 | $2,982 | $2.86 | 1d | 21 | 0.17mi |
| 900 SW 142nd Ave Pembroke Pines, FL | 2.0 | 2.0 | 1207 | $2,200 | $1.82 | 1d | 2 | 0.18mi |
| 900 SW 142nd Ave Unit 202L Pembroke Pines, FL | 2.0 | 2.0 | 1207 | $2,300 | $1.91 | 7d | 1 | 0.18mi |
| 1001 SW 141st Ave Unit 311K Pembroke Pines, FL | 1.0 | 1.5 | 1056 | $1,900 | $1.80 | 3d | 1 | 0.22mi |
| 550 SW 138th Ave Unit 206K Pembroke Pines, FL | 2.0 | 2.0 | 1207 | $2,400 | $1.99 | 14d | 1 | 0.27mi |
| 13701 SW 12th St Apt 103A Pembroke Pines, FL | 2.0 | 2.0 | 1207 | $2,500 | $2.07 | 2d | 1 | 0.36mi |
| 301 SW 135th Ave Unit 415C Pembroke Pines, FL | 1.0 | 1.5 | 811 | $1,650 | $2.03 | 22d | 1 | 0.36mi |
| 1351 SW 141st Ave Unit 213G Pembroke Pines, FL | 2.0 | 2.0 | 1207 | $1,800 | $1.49 | 17d | 1 | 0.37mi |
| 551 SW 135th Ave Unit 405B Pembroke Pines, FL | 2.0 | 1.5 | 953 | $1,700 | $1.78 | 24d | 1 | 0.39mi |
| 13455 SW 9th Ct Pembroke Pines, FL | 1.0 | 1.5 | 811 | $1,685 | $2.08 | 22d | 2 | 0.45mi |
| 850 SW 133rd Ter Pembroke Pines, FL | 2.0 | 1.5 | 953 | $1,938 | $2.03 | 1d | 2 | 0.47mi |
| 850 SW 133rd Ter Pembroke Pines, FL | 2.0 | 1.5 | 953 | $1,938 | $2.03 | 20d | 2 | 0.47mi |
| 850 SW 133rd Ter Unit 106B Pembroke Pines, FL | 2.0 | 1.5 | 953 | $1,975 | $2.07 | 22d | 1 | 0.47mi |
| 850 SW 133rd Ter Unit B406 Pembroke Pines, FL | 2.0 | 1.5 | 953 | $1,900 | $1.99 | 24d | 1 | 0.47mi |
| 801 SW 133rd Ter Unit 401K Pembroke Pines, FL | 1.0 | 1.0 | 960 | $1,850 | $1.93 | 24d | 1 | 0.51mi |
| 13455 SW 3rd St Unit 309S Pembroke Pines, FL | 1.0 | 1.5 | 811 | $1,700 | $2.10 | 24d | 1 | 0.52mi |
| 13355 SW 9th Ct Unit 317H Pembroke Pines, FL | 2.0 | 2.0 | 1044 | $1,975 | $1.89 | 5d | 1 | 0.52mi |
| 13250 SW 7th Ct Unit 402L Pembroke Pines, FL | 2.0 | 2.0 | 1044 | $1,750 | $1.68 | 2d | 1 | 0.53mi |
| 13250 SW 7th Ct Unit 402L Pembroke Pines, FL | 2.0 | 2.0 | 1044 | $1,750 | $1.68 | 14d | 1 | 0.53mi |
| 13500 SW 1st St Pembroke Pines, FL | 2.0 | 1.5 | 954 | $1,750 | $1.83 | 5d | 2 | 0.54mi |
| 13500 SW 1st St Pembroke Pines, FL | 2.0 | 1.5 | 954 | $1,750 | $1.83 | 24d | 2 | 0.54mi |
| 400 SW 134th Way Pembroke Pines, FL | 1.0–2.0 | 1.5–2.0 | 927 | $2,000 | $2.16 | 24d | 3 | 0.55mi |
| 400 SW 134th Way Pembroke Pines, FL | 1.0–2.0 | 1.5–2.0 | 927 | $2,000 | $2.16 | 10d | 2 | 0.55mi |
| 400 SW 134th Way Unit 302F Pembroke Pines, FL | 2.0 | 2.0 | 1044 | $2,000 | $1.92 | 7d | 1 | 0.55mi |
| 150 SW 134th Way Pembroke Pines, FL | 2.0 | 1.5–2.0 | 1060 | $1,800 | $1.70 | 24d | 2 | 0.56mi |
| 150 SW 134th Way Unit 314R Pembroke Pines, FL | 2.0 | 2.0 | 1166 | $1,900 | $1.63 | 7d | 1 | 0.56mi |
| 150 SW 134th Way Unit 314R Pembroke Pines, FL | 2.0 | 2.0 | 1166 | $1,900 | $1.63 | 14d | 1 | 0.56mi |
| 1401 SW 134th Way Unit C314 Pembroke Pines, FL | 2.0 | 2.0 | 1044 | $2,700 | $2.59 | 24d | 1 | 0.57mi |
| 13255 SW 7th Ct Unit 406D Pembroke Pines, FL | 2.0 | 1.5 | 953 | $1,850 | $1.94 | 7d | 1 | 0.58mi |
| 13255 SW 7th Ct Unit 305D Pembroke Pines, FL | 2.0 | 1.5 | 953 | $1,850 | $1.94 | 24d | 1 | 0.58mi |
HOA detail condo
- Monthly dues
- $472 · $5,664/yr
- Likely covers
- poolgym
- Assessments
- None detected in remarks — confirm with the listing agent.
Listing history 33 events
-
2026-06-18days on market $260,000 Active 155 DOM
-
2026-06-17days on market $260,000 Active 154 DOM
-
2026-06-16days on market $260,000 Active 153 DOM
-
2026-06-15days on market $260,000 Active 152 DOM
-
2026-06-13days on market $260,000 Active 150 DOM
-
2026-06-09days on market $260,000 Active 146 DOM
-
2026-06-07days on market $260,000 Active 144 DOM
-
2026-06-04days on market $260,000 Active 141 DOM
-
2026-06-03days on market $260,000 Active 140 DOM
-
2026-06-02days on market $260,000 Active 139 DOM
-
2026-06-01days on market $260,000 Active 138 DOM
-
2026-05-31days on market $260,000 Active 137 DOM
-
2026-05-15price $260,000
-
2026-01-14$295,000 Active
-
2025-12-23historical
-
2025-09-23$295,000 Active
-
2025-07-01price $299,000
-
2025-06-03price $300,000
-
2025-05-07price $305,000
-
2025-04-01status Active
-
2024-08-14price $315,000
-
2024-05-20price $320,000
-
2024-04-22price $325,000
-
2024-03-26$330,000 Active
-
2024-03-04historical
-
2024-02-10price $320,000
-
2024-01-06$330,000 Active
-
2023-09-01soldstatus $325,000
-
2023-08-31soldstatus $325,000 Closed
-
2023-08-09status Pending
-
2023-08-01$320,000 Active
-
2023-06-09soldstatus $205,000
-
1997-05-21soldstatus $76,100
ⓘ Source: listings_history table (triggers on properties + properties_extension) + one-shot
backfill from property_details.listing_events for pre-trigger history.
Tax reassessment forecast FL · Resets to sale price
- Current annual tax
- $3,144 · $262/mo
- Projected year-2 tax
- $3,144 · $262/mo
- Expected delta
- $0/yr ($0/mo · 0.0%)
ⓘ Screening estimate from a state-policy table — verify with the county assessor before closing.
Climate risk First Street
- Flood 1/10 Low FEMA zone X (unshaded) · 0% chance over 30 yrs
- Wildfire 1/10 Low
- Heat 10/10 Extreme 7 d/yr ≥106°F today · 26 d/yr by 30 yrs out
- Wind 10/10 Extreme 99% chance of damaging wind over 30 yrs
- Air quality 2/10 Low 2 unhealthy d/yr today · 2 by 30 yrs out
Nearby sold comps map
Loading sold comps map…
Walkable amenities ~0.75 mi
Loading nearby amenities…
Taxation est. · year 1
- Rental income
- $29,222
- − Mortgage interest
- −$14,564
- − Property taxes
- −$3,144
- − Insurance
- −$1,300
- − Repairs & maintenance
- −$2,338
- − Management
- −$2,338
- − HOA
- −$5,664
- − Depreciation
- −$7,564
- Taxable loss
- −$7,689
- Est. tax savings @ 24.0%
- +$1,845
- After-tax cash flow
- $-1,539/yr
For passive investors: Depreciation is non-cash, so a rental often shows a tax loss while cash-flowing — sheltering income. Rental losses are passive: they offset passive income freely, and up to $25,000/yr can offset ordinary (W-2) income if you actively participate and your MAGI is under $100k (phasing out to $0 by $150k); unused losses carry forward. On sale, claimed depreciation is recaptured at up to 25%, and gains may owe capital-gains tax (a 1031 exchange can defer both). Figures are a year-1 estimate at your 24.0% rate — not tax advice; consult a CPA.
Schools (NCES district)
- District
- Broward
- NCES district ID
- 1200180
- Math proficiency
- 42% ▼ -18.00%
- Reading proficiency
- 53% ▼ -5.00%
- Median HH income
- $52,139
- Composite
- 40.88/100
- National rank
- #3621
- State rank
- #46 of 73 in FL
Livability — Pembroke Pines
- Score
- 83/100
- State rank
- #54
- US rank
- #933
Category grades
Schools grade is shown separately in the Schools card above.
Census & demographics
- Census place
- Pembroke Pines, FL
- County
- Broward County · 1,963,430 people
- City population
- 180,224
- Metro
- Miami-Fort Lauderdale-Pompano Beach, FL
- Population (ZIP)
- 65,116
- Household income
- $76,561
- Rent vs Own
- Severe rent burden
- 1728.0
Population outlook (Broward County) Hauer SSP2
- Today (2025)
- 2,207,033 people
- By 2030
- 2,360,704 · +7.0%
- By 2040
- 2,661,208 · +20.6%
- By 2050
- 2,946,698 · +33.5%
- By 2075
- 3,602,273 · +63.2%
- By 2100
- 3,970,984 · +79.9%
Race, ethnicity, and origin ACS 2023
- Neighborhood character
- Diverse neighborhood (Simpson 0.65)
- Race & ethnicity
- Hispanic / Latino 52% Two or more races 23% Black 22% White 16% Asian 6%
- Hispanic origin (detail)
- Puerto Rican 6% Cuban 19% Dominican 3%
- Common ancestry
- Hispanic 6% Romanian 1% Scotch-Irish 1%
- Foreign-born
- 47% · Canada, Jamaica, Vietnam
- Languages at home
- 40% English-only · Spanish 47% French/Haitian/Cajun 5% Other Indo-European 2%
Political lean MEDSL · Broward
- 2024 margin
- D (+17.0) · D 58.0% · R 41.0%
- 2008→2024 swing
- -17.8pp toward R · 2008: 34.7pp · 2024: 17.0pp
- All cycles
- 2024: D+17.0 2020: D+29.8 2016: D+35.0 2012: D+34.9 2008: D+34.7
Not yet ingested
- Civics
- —
Market trends
- HPI YoY
- ▼ -2.01%
- Current HPI
- 359.5973
- Rent YoY
- ▼ -0.20%
- Metro
- Miami-Fort Lauderdale-Pompano Beach, FL
- State GDP YoY
- ▲ 3.28%
- F500 in state
- 36
Industry mix (Fortune 500 HQ in FL)
| Industry | F500 HQs | Revenue |
|---|---|---|
| Industrial Technology | 2 | $29B |
|
||
| Insurance | 2 | $17B |
|
||
| Retail | 1 | $60B |
|
||
| Technology Distribution | 1 | $58B |
|
||
| Homebuilding | 1 | $35B |
|
||
| Technology Manufacturing | 1 | $35B |
|
||
Price history
+241.7% since first listed21 events — show timeline
- 2026-05-15 Price Changed $260,000 MARMLS
- 2026-01-14 Listed $295,000 MARMLS
- 2025-12-23 Listing Removed — MARMLS
- 2025-09-23 Listed $295,000 MARMLS
- 2025-07-01 Price Changed $299,000 MARMLS
- 2025-06-03 Price Changed $300,000 MARMLS
- 2025-05-07 Price Changed $305,000 MARMLS
- 2025-04-01 Relisted — MARMLS
- 2024-08-14 Price Changed $315,000 MARMLS
- 2024-05-20 Price Changed $320,000 MARMLS
- 2024-04-22 Price Changed $325,000 MARMLS
- 2024-03-26 Listed $330,000 MARMLS
- 2024-03-04 Listing Removed — MARMLS
- 2024-02-10 Price Changed $320,000 MARMLS
- 2024-01-06 Listed $330,000 MARMLS
- 2023-09-01 Sold (Public Records) $325,000 Public Records
- 2023-08-31 Sold (MLS) $325,000 MARMLS
- 2023-08-09 Pending — MARMLS
- 2023-08-01 Listed $320,000 MARMLS
- 2023-06-09 Sold (Public Records) $205,000 Public Records
- 1997-05-21 Sold (Public Records) $76,100 Public Records
Property tax history
+5.2%/yrLatest (2025): $3,144 · -9.8% YoY. Source: county tax records.
Cash-flow waterfall
monthlySold comps — $/sqft
last 12 mo · ≤1 miLoading sold comps…