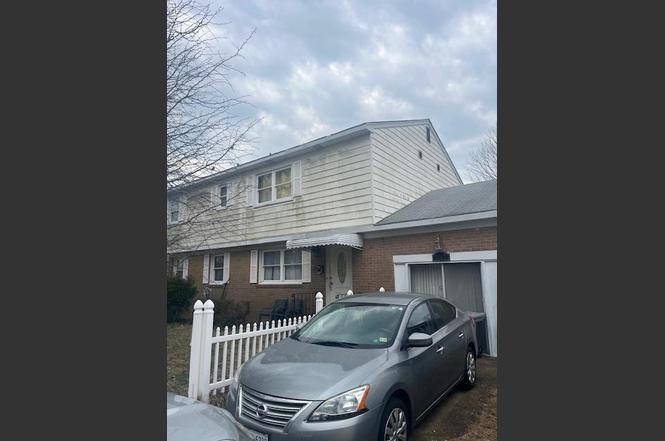
1642 N Mallory St
Hampton, VA 23664
$260,000B-
4 bd · 2.0 ba ·
2,374 sqft ·
Built 1967
· SingleFamily
· Under Contract
· 53 DOM
Cashflow @ list (25.0% down · 7.5%)
Estimated rent
$2,837/mo
Mortgage (P&I)
−$1,363
Tax + insurance
−$381
HOA
−$0
Vac / Maint / Mgmt
−$596
Net cashflow
$497/mo
Annual
$5,965/yr
Cap rate
8.59%
Cash-on-cash
8.19%
DSCR
1.36
1% rule
1.09%
Cash to close
$72,800
Investor read
- This is a 4-bed/2.0-bath single-family listed at $260k.
- At list price, monthly cash flow is $497 ($6k/yr) — positive.
- The deal already cash-flows at list — no discount required.
- Meets the 1% rule at list price ($3k rent vs $260k).
- It's been on market 53 days — a 3% lower offer ($252k) is reasonable based on typical stale-listing flexibility.
- Recommended offer: $252k (3.0% below list) — sets the bar for market timing.
- Local home prices are declining (-3.0%/yr); year-one equity from $2k of loan paydown is wiped out by about $8k of value loss. Plan a longer hold.
- Location reads 75/100 on livability (#133 in VA, #4,302 nationally) — a middle-class / working-renter tenant base. Strengths: housing A+, health & safety A+, cost of living A; Watch: crime C-, amenities D+, commute F.
- Hampton City Public School District (urban): math 60% / reading 70% proficiency, ranked #40 of 131 in VA (top 30%) — acceptable for families but not a draw, mixed tenant base, ~2y average lease.
- Zoned schools: Jane H. Bryan Elementary (math 42% / reading 57%, grade D, #742 of 1,108 statewide, top 70%, 376 students, 82% FRL); Phoebus High (math 57% / reading 76%, grade B, #195 of 319 statewide, top 62%, 1,365 students, 86% FRL) — zoned schools average 84% FRL vs 49% district-wide (35 pts higher); higher-poverty schools than district average — tighter screening recommended.
- Market conditions: 97 active listings in the ZIP; 6 comparable units currently listed for rent nearby; rentals lingering (median 45d on market — plan ~5-8 weeks vacancy on turnover, expect pricing pressure); 67% of comp listings sitting > 30 days — soft ceiling on asking rent; solid renter incomes; 68 units permitted in Hampton city in 2024 (0 in 5+ unit buildings).
- Hampton County population projected at -13% by 2050 — secular population decline; favor cash flow + early exit over multi-decade hold.
- Climate carrying-cost: major flood risk; severe wind risk, 80% chance of damaging wind over 30y; extreme-heat days projected 7→17/yr by 2055 (HVAC capex compounding) — expect insurance premiums to compound above CPI over the hold.
- Cap rate 8.6% vs local median 4.5% in Hampton — top-decile yield for the area; either an underpriced asset or a hidden risk that comps aren't pricing in. Stress-test before assuming the spread holds.
- This rent runs 39% of the median local income ($87k/yr) — at the standard rent-burdened threshold; future hikes will face affordability resistance.
Questions for listing agent
- It's been on market 53 days. Have you received any prior offers? Is the seller open to a 3% concession, seller financing, or rate buy-down credit?
- Built in 1967 — when were the roof, HVAC, electrical panel, plumbing, and water heater last replaced?
- Is there a deadline driving the sale (1031 exchange, divorce, estate, relocation)? That informs how much negotiation room exists.
- Schools are B-rated — typically a magnet for longer-tenancy family renters. What's the average tenant stay here, and is there a school-zone premium baked into asking?
- What's the average days-on-market for RENTAL listings here right now (not sales)? A rising rental-DOM trend means longer vacancies and softer asking-rent achievability than the comps imply.
- What's the recent tenant-quality profile in this submarket — average credit score on applications, eviction rate, late-payment / NSF rate, and stable-employment percentage? A property-management company in the area should have these aggregated.
- How much new for-sale + rental construction is in the pipeline within 1–3 miles? Heavy new supply typically softens prices + rents 12–24 months out; constrained supply supports both.
CashFlowRE · CFR-WFHB6015J89NY0
· Data 1 week ago
cashflowre.app · 2026-05-29