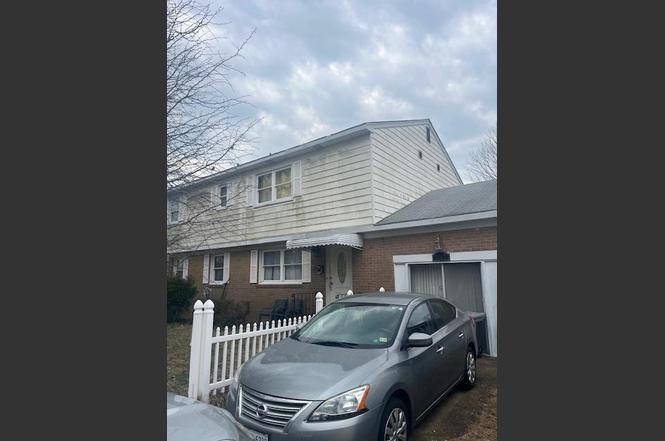
1642 N Mallory St · Hampton, VA
Flood risk 6/10 · Moderate
- FEMA flood zone
- X (unshaded)
- Chance of flooding over 30 yrs
- 0.63%
- Est. flood insurance / yr
- $473 – $860
Fire risk 1/10 · Minimal
- Est. fire insurance / yr
- $666 – $1,236
Heat risk 9/10 · Severe
- Hot days now (above 105°F)
- 7 days/yr
- Hot days in 30 yrs
- 17 days/yr
Wind risk 8/10 · Major
- Chance of severe wind over 30 yrs
- 80.0%
Air-quality risk 2/10 · Minimal
- Unhealthy air days now
- 2 days/yr
- Unhealthy air days in 30 yrs
- 2 days/yr
Risk factors via First Street. Map © Google.
Why this score? — see what drove the B- grade
The composite is a weighted blend of 9 inputs, each scored 0–100. Each bar is that input's sub-score; the figure is the points it added to the 100-point composite (weight × sub-score).
- Cash flow +23.7/30.0
- ARV discount +15.0/15.0
- DSCR +7.6/10.0
- 1% rule +5.9/10.0
- Schools +5.5/10.0
- Livability +3.8/5.0
- Rent growth +2.5/5.0
- Condition / age +2.5/5.0
- Appreciation +0.0/10.0
$260,000
🖨 Deal sheet (PDF) 📄 Offer letter ✓ Due diligence
Listing remarks
Beautiful home with some updates. Property being sold as is.
Key facts
- Built 1967
- Listed 53 days
Neighborhood map
What this means for you Summary
Snapshot
- This is a 4-bed/2.0-bath single-family listed at $260k.
Deal economics
- At list price, monthly cash flow is $497 ($6k/yr) — positive.
- The deal already cash-flows at list — no discount required.
- Meets the 1% rule at list price ($3k rent vs $260k).
- Recommended offer: $252k (3.0% below list) — sets the bar for market timing.
- Cap rate 8.6% vs local median 4.5% in Hampton — top-decile yield for the area; either an underpriced asset or a hidden risk that comps aren't pricing in. Stress-test before assuming the spread holds.
Location & tenants
- Location reads 75/100 on livability (#133 in VA, #4,302 nationally) — a middle-class / working-renter tenant base. Strengths: housing A+, health & safety A+, cost of living A; Watch: crime C-, amenities D+, commute F.
- Hampton City Public School District (urban): math 60% / reading 70% proficiency, ranked #40 of 131 in VA (top 30%) — acceptable for families but not a draw, mixed tenant base, ~2y average lease.
- Zoned schools: Jane H. Bryan Elementary (math 42% / reading 57%, grade D, #742 of 1,108 statewide, top 70%, 376 students, 82% FRL); Phoebus High (math 57% / reading 76%, grade B, #195 of 319 statewide, top 62%, 1,365 students, 86% FRL) — zoned schools average 84% FRL vs 49% district-wide (35 pts higher); higher-poverty schools than district average — tighter screening recommended.
- Market conditions: 97 active listings in the ZIP; 6 comparable units currently listed for rent nearby; rentals lingering (median 44d on market — plan ~5-8 weeks vacancy on turnover, expect pricing pressure); 67% of comp listings sitting > 30 days — soft ceiling on asking rent; solid renter incomes; 68 units permitted in Hampton city in 2024 (0 in 5+ unit buildings).
- This rent runs 39% of the median local income ($87k/yr) — at the standard rent-burdened threshold; future hikes will face affordability resistance.
Forward outlook
- Local home prices are declining (-3.0%/yr); year-one equity from $2k of loan paydown is wiped out by about $8k of value loss. Plan a longer hold.
- Hampton County population projected at -13% by 2050 — secular population decline; favor cash flow + early exit over multi-decade hold.
Negotiation context
- It's been on market 53 days — a 3% lower offer ($252k) is reasonable based on typical stale-listing flexibility.
Risks & watch-outs
- Climate carrying-cost: major flood risk; severe wind risk, 80% chance of damaging wind over 30y; extreme-heat days projected 7→17/yr by 2055 (HVAC capex compounding) — expect insurance premiums to compound above CPI over the hold.
Questions for the listing agent
- It's been on market 53 days. Have you received any prior offers? Is the seller open to a 3% concession, seller financing, or rate buy-down credit?
- Built in 1967 — when were the roof, HVAC, electrical panel, plumbing, and water heater last replaced?
- Is there a deadline driving the sale (1031 exchange, divorce, estate, relocation)? That informs how much negotiation room exists.
- Schools are B-rated — typically a magnet for longer-tenancy family renters. What's the average tenant stay here, and is there a school-zone premium baked into asking?
- What's the average days-on-market for RENTAL listings here right now (not sales)? A rising rental-DOM trend means longer vacancies and softer asking-rent achievability than the comps imply.
- What's the recent tenant-quality profile in this submarket — average credit score on applications, eviction rate, late-payment / NSF rate, and stable-employment percentage? A property-management company in the area should have these aggregated.
- How much new for-sale + rental construction is in the pipeline within 1–3 miles? Heavy new supply typically softens prices + rents 12–24 months out; constrained supply supports both.
Investment metrics
- 1% rule
- 1.09% ✓
- Cap rate
- 8.59%
- Cash-on-cash
- 8.19%
- DSCR
- 1.36
- GRM
- 7.6
CMA / ARV
- ARV (on-the-fly)
- $496,166
- Comps found
- 6
Show comp detail 6 sales within ~0.75 mi
| Address | Dist | Beds/Ba | Sqft | Sold | Price | $/sf | Match |
|---|---|---|---|---|---|---|---|
| 1365 Old Buckroe Rd | 0.33mi | 3/2.5 (-1) | 2,556 (+8%) | 10mo | $400,000 | $156 | 56 |
| 1333 N Mallory St | 0.55mi | 3/2.0 (-1) | 2,612 (+10%) | 1mo | $192,000 | $74 | 52 |
| 34 E Berkley Dr | 0.65mi | 4/3.0 | 2,618 (+10%) | 0mo | $549,900 | $210 | 48 |
| 27 E Berkley Dr | 0.62mi | 3/2.5 (-1) | 2,174 (-8%) | 3mo | $451,000 | $207 | 48 |
| 356 Atlantic Ave | 0.40mi | 4/2.5 | 2,022 (-15%) | 13mo | $440,000 | $218 | 43 |
| 1918 N Mallory St | 0.60mi | 3/3.5 (-1) | 2,632 (+11%) | 19mo | $550,000 | $209 | 27 |
Match score weights: distance 35% · size 25% · config 20% · recency 20%. Top-matched comps best support the ARV.
Projected returns pro-forma
-3.0% appreciation · 3.0% rent growth · sell at horizon
- IRR
- -3.8%
- Equity multiple
- 0.86×
- Total profit
- $-10,463
- Equity at exit
- $38,767
- IRR
- 5.9%
- Equity multiple
- 1.44×
- Total profit
- $31,696
- Equity at exit
- $22,480
Cash invested: $72,800 (down + closing). Projections, not guarantees.
Landlord ↔ Tenant lean methodology
- Overall (STATE)
- 55 Moderately Landlord-Leaning
- State Virginia
- 55 Moderately Landlord-Leaning · D+2
- County
- — inherits STATE
- City
- — inherits STATE
ZIP-level market 23664
- Home prices YoY
- -23.6%
- Active inventory
- 97
- Price-to-rent
- 7.6×
Monthly cashflow live
- Estimated rent
- $2,837 high interval (Pro) →
- Mortgage (P&I)
- −$1,363
- Tax from tax record
- −$272 /mo · $3,270/yr
- Insurance
- −$108
- HOA
- −$0
- Vacancy / Maint / Mgmt
- −$596
- Net cashflow
- $497
Break-even live
Sensitivity live
| Price | -10% $644 | -5% $571 | +0% $497 | +5% $423 | +10% $350 |
|---|---|---|---|---|---|
| Rent | -10% $273 | -5% $385 | +0% $497 | +5% $609 | +10% $721 |
| Rate | -1.0pp $628 | -0.5pp $563 | base $497 | +0.5pp $430 | +1.0pp $361 |
UW: 25.0% down · 7.5% · 30yr · 1.5% tax · 5.0% vac · 8.0% maint · 8.0% mgmt
Financing live
Cash to close
- Down payment
- $65,000
- Closing costs
- $7,800
- Reserves months
- —
- Total cash needed
- —
Loan-product check · same deal, 3 products live
Conventional
25% down · 7.5% · 30yr
- Down + closing
- —
- Monthly P&I
- —
- Monthly cashflow
- —
- DSCR
- —
- Eligible?
- —
Personal DTI + credit; lowest rate.
DSCR
20% down · 8.5% · 30yr
- Down + closing
- —
- Monthly P&I
- —
- Monthly cashflow
- —
- DSCR
- —
- Eligible?
- —
No personal income docs; deal must DSCR.
Hard money
10% down · 12.0% · 12mo
- Down + closing
- —
- Monthly P&I
- —
- Monthly cashflow
- —
- DSCR
- —
- Eligible?
- —
Short-term bridge; refi at stabilization.
Rent comps 6 comps
| Address | Beds | Baths | Sqft | Rent | $/sqft | DOM | Units | Dist |
|---|---|---|---|---|---|---|---|---|
| 2604 E Pembroke Ave Hampton, VA | 3.0 | 3.5 | 2744 | $3,000 | $1.09 | 3d | 1 | 0.48mi |
| 2109 Newton Rd Hampton, VA | 2.0–4.0 | 1.0–1.5 | 1700 | $2,312 | $1.36 | 2d | 3 | 1.01mi |
| 5 Lacrosse St Hampton, VA | 3.0 | 2.5 | 1612 | $2,500 | $1.55 | 44d | 1 | 1.20mi |
| 1757 Lafayette Dr Hampton, VA | 5.0 | 4.0 | 2873 | $3,000 | $1.04 | 44d | 1 | 1.25mi |
| 11 Camellia Ln Hampton, VA | 3.0 | 2.5 | 1650 | $2,400 | $1.45 | 44d | 1 | 1.42mi |
| 510 Kingston Hall Ct Hampton, VA | 3.0 | 2.0 | 2000 | $2,300 | $1.15 | 44d | 1 | 1.47mi |
Listing history 5 events
-
2026-04-13status Under Contract
-
2026-03-17price $260,000
-
2026-02-18$284,000 Active
-
2008-01-28soldstatus $232,000
-
2005-09-23soldstatus $176,000
ⓘ Source: listings_history table (triggers on properties + properties_extension) + one-shot
backfill from property_details.listing_events for pre-trigger history.
Tax reassessment forecast VA · Resets to sale price
- Current annual tax
- $3,270 · $272/mo
- Projected year-2 tax
- $3,270 · $272/mo
- Expected delta
- $0/yr ($0/mo · 0.0%)
ⓘ Screening estimate from a state-policy table — verify with the county assessor before closing.
Climate risk First Street
- Flood 6/10 Major FEMA zone X (unshaded) · 63% chance over 30 yrs
- Wildfire 1/10 Low
- Heat 9/10 Extreme 7 d/yr ≥105°F today · 17 d/yr by 30 yrs out
- Wind 8/10 Severe 80% chance of damaging wind over 30 yrs
- Air quality 2/10 Low 2 unhealthy d/yr today · 2 by 30 yrs out
Nearby sold comps map
Loading sold comps map…
Walkable amenities ~0.75 mi
Loading nearby amenities…
Taxation est. · year 1
- Rental income
- $34,045
- − Mortgage interest
- −$14,564
- − Property taxes
- −$3,270
- − Insurance
- −$1,300
- − Repairs & maintenance
- −$2,724
- − Management
- −$2,724
- − Depreciation
- −$7,564
- Taxable income
- $1,901
- Est. tax owed @ 24.0%
- −$456
- After-tax cash flow
- $5,508/yr
For passive investors: Depreciation is non-cash, so a rental often shows a tax loss while cash-flowing — sheltering income. Rental losses are passive: they offset passive income freely, and up to $25,000/yr can offset ordinary (W-2) income if you actively participate and your MAGI is under $100k (phasing out to $0 by $150k); unused losses carry forward. On sale, claimed depreciation is recaptured at up to 25%, and gains may owe capital-gains tax (a 1031 exchange can defer both). Figures are a year-1 estimate at your 24.0% rate — not tax advice; consult a CPA.
Schools (NCES district)
- District
- Hampton City Public School District
- NCES district ID
- 5101800
- Math proficiency
- 60% ▼ -21.00%
- Reading proficiency
- 70% ▼ -4.00%
- Median HH income
- $50,089
- Composite
- 55.19/100
- National rank
- #1272
- State rank
- #40 of 131 in VA
Livability — Hampton
- Score
- 75/100
- State rank
- #133
- US rank
- #4302
Category grades
Schools grade is shown separately in the Schools card above.
Census & demographics
- Census place
- Hampton, VA
- County
- Hampton City · 132,421 people
- City population
- 132,421
- Metro
- Virginia Beach-Norfolk-Newport News, VA-NC
- Population (ZIP)
- 9,643
- Household income
- $87,412
- Rent vs Own
- Severe rent burden
- 394.0
Population outlook (Hampton County) Hauer SSP2
- Today (2025)
- 134,055 people
- By 2030
- 131,753 · -1.7%
- By 2040
- 125,017 · -6.7%
- By 2050
- 116,825 · -12.9%
- By 2075
- 97,033 · -27.6%
- By 2100
- 76,188 · -43.2%
Race, ethnicity, and origin ACS 2023
- Neighborhood character
- Predominantly White (67%)
- Race & ethnicity
- White 67% Black 24% Two or more races 4% Hispanic / Latino 3%
- Common ancestry
- Slovak 2% Lithuanian 2% Italian 2%
- Foreign-born
- 3% · Canada, Guatemala
- Languages at home
- 97% English-only · Arabic 1% Spanish 1%
Political lean MEDSL · Hampton
- 2024 margin
- Solid D (+39.9) · D 69.2% · R 29.4% · Other 1.4%
- 2008→2024 swing
- +1.0pp no change · 2008: 38.9pp · 2024: 39.9pp
- All cycles
- 2024: D+39.9 2020: D+42.2 2016: D+37.8 2012: D+45.4 2008: D+38.9
Not yet ingested
- Civics
- —
Market trends
- HPI YoY
- ▼ -73.71%
- Current HPI
- 238.491
- Rent YoY
- —
- Metro
- Virginia Beach-Norfolk-Newport News, VA-NC
- State GDP YoY
- ▲ 2.40%
- F500 in state
- 50
Industry mix (Fortune 500 HQ in VA)
| Industry | F500 HQs | Revenue |
|---|---|---|
| Aerospace / Defense | 4 | $236B |
|
||
| Technology / Defense | 3 | $32B |
|
||
| Financial Services | 2 | $176B |
|
||
| Utilities | 2 | $27B |
|
||
| Insurance | 2 | $25B |
|
||
| Technology | 2 | $15B |
|
||
Price history
+47.7% since first listed5 events — show timeline
- 2026-04-13 Pending — REINMLS
- 2026-03-17 Price Changed $260,000 REINMLS
- 2026-02-18 Listed $284,000 REINMLS
- 2008-01-28 Sold (Public Records) $232,000 Public Records
- 2005-09-23 Sold (Public Records) $176,000 Public Records
Property tax history
+7.3%/yrLatest (2025): $3,270 · -0.9% YoY. Source: county tax records.
Cash-flow waterfall
monthlySold comps — $/sqft
last 12 mo · ≤1 miLoading sold comps…