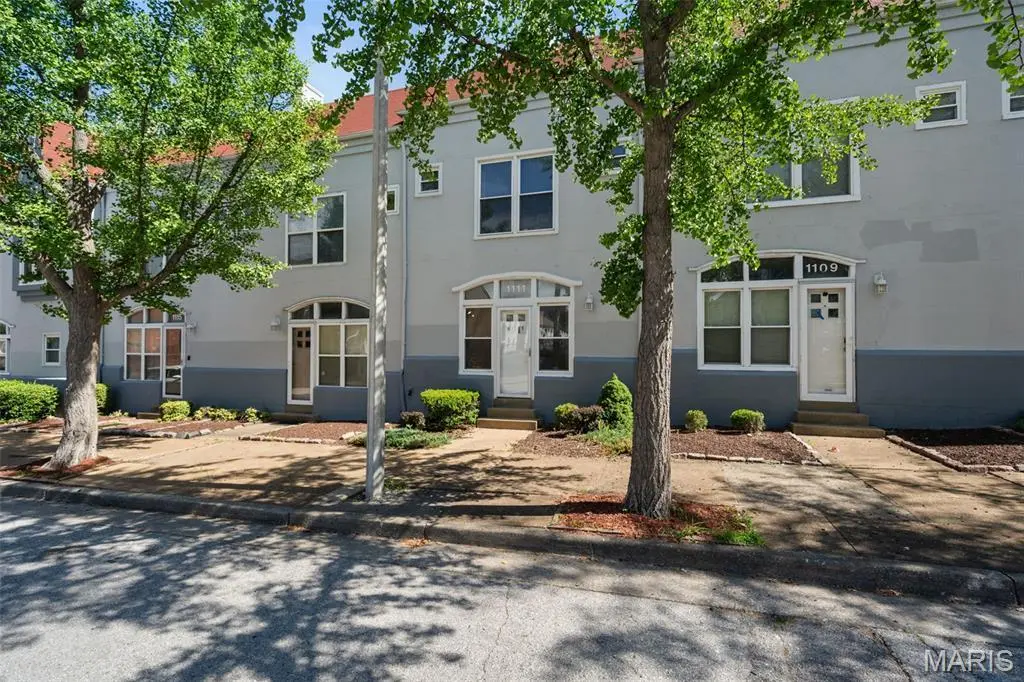
1111 Biddle St
St. Louis, MO 63106
$120,000C+
2 bd · 1.5 ba ·
900 sqft ·
Built 1988
· Townhouse
· Pending
· 20 DOM
Cashflow @ list (25.0% down · 7.5%)
Estimated rent
$1,452/mo
Mortgage (P&I)
−$629
Tax + insurance
−$98
HOA
−$50
Vac / Maint / Mgmt
−$305
Net cashflow
$370/mo
Annual
$4,437/yr
Cap rate
9.99%
Cash-on-cash
13.21%
DSCR
1.59
1% rule
1.21%
Cash to close
$33,600
Investor read
- This is a 2-bed/1.5-bath townhouse listed at $120k.
- At list price, monthly cash flow is $370 ($4k/yr) — positive.
- The deal already cash-flows at list — no discount required.
- Meets the 1% rule at list price ($1k rent vs $120k).
- It's been on market 20 days — a 2% lower offer ($118k) is reasonable based on typical stale-listing flexibility.
- Recommended offer: $118k (1.5% below list) — sets the bar for market timing.
- In year one you build about $3k of equity ($830 loan paydown + $2k appreciation (1.9% local appreciation)).
- Location reads: area grade C — affects rentability + tenant quality, not the cash-flow math above.
- St. Louis City (urban): math 10% / reading 18% proficiency, ranked #312 of 324 in MO (top 96%) — low school quality limits family demand, transient renter base, plan for 1-2y turnover; 80% free/reduced lunch — lower-income household profile, screen leases tightly.
- Zoned schools: Henry Elem. (math 2% / reading 2%, grade F, #1,099 of 1,115 statewide, top 100%, 204 students, 98% FRL); Vashon High (math 2% / reading 2%, grade F, #520 of 521 statewide, top 100%, 568 students, 100% FRL) — zoned schools average 99% FRL vs 80% district-wide (18 pts higher); higher-poverty schools than district average — tighter screening recommended.
- Market conditions: 15 active listings in the ZIP; 40 comparable units currently listed for rent nearby; rentals leasing fast (median 8d on market — plan ~1-2 weeks tenant-placement turnaround); 294 units permitted in St. Louis city in 2024 (227 in 5+ unit buildings).
- St. Louis County population projected to shrink 6% by 2050 — rents likely to lag national; underwrite the cash flow, not the appreciation.
- 4 sale attempts since 6y ago with the ask held roughly flat each time — persistent listings suggest the price (not the market) is what's stuck; bring a comps-based counter.
- Current owner paid $67k; list at $120k implies a 79% gain — meaningful room to come down on a strong offer.
- At projected returns (1.9% appreciation + 3.0% rent growth), your $34k cash investment doubles in ~5 years — after that, you're playing with house money.
- By year 10, paydown + projected appreciation supports a ~$31k cash-out refi (75% LTV) — recoverable capital for the next deal without selling this one.
- Climate carrying-cost: extreme-heat days projected 7→21/yr by 2055 (HVAC capex compounding) — expect insurance premiums to compound above CPI over the hold.
- Cap rate 10.0% vs local median 5.0% in St. Louis — top-decile yield for the area; either an underpriced asset or a hidden risk that comps aren't pricing in. Stress-test before assuming the spread holds.
Questions for listing agent
- What does the HOA fee cover, when was the last increase, and are there any pending special assessments or reserve-fund shortfalls?
- Is there a deadline driving the sale (1031 exchange, divorce, estate, relocation)? That informs how much negotiation room exists.
- What's the average days-on-market for RENTAL listings here right now (not sales)? A rising rental-DOM trend means longer vacancies and softer asking-rent achievability than the comps imply.
- What's the recent tenant-quality profile in this submarket — average credit score on applications, eviction rate, late-payment / NSF rate, and stable-employment percentage? A property-management company in the area should have these aggregated.
- How much new for-sale + rental construction is in the pipeline within 1–3 miles? Heavy new supply typically softens prices + rents 12–24 months out; constrained supply supports both.
CashFlowRE · CFR-WFPWCZ5A7H7YMX
· Data 1 day ago
cashflowre.app · 2026-05-29