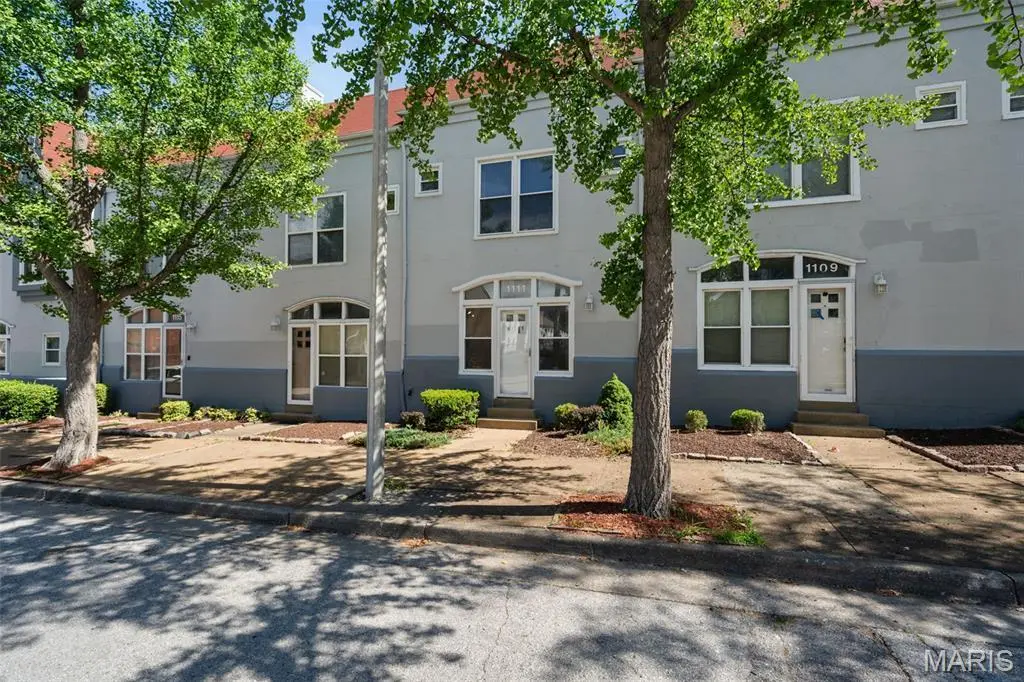
1111 Biddle St · St. Louis, MO
Flood risk 1/10 · Minimal
- FEMA flood zone
- X (unshaded)
- Chance of flooding over 30 yrs
- 0.0%
- Est. flood insurance / yr
- $507 – $1,088
Fire risk 1/10 · Minimal
- Est. fire insurance / yr
- $1,054 – $1,958
Heat risk 5/10 · Moderate
- Hot days now (above 109°F)
- 7 days/yr
- Hot days in 30 yrs
- 21 days/yr
Wind risk 2/10 · Minimal
- Chance of severe wind over 30 yrs
- 1.0%
Air-quality risk 3/10 · Minor
- Unhealthy air days now
- 3 days/yr
- Unhealthy air days in 30 yrs
- 4 days/yr
Risk factors via First Street. Map © Google.
Why this score? — see what drove the C+ grade
The composite is a weighted blend of 9 inputs, each scored 0–100. Each bar is that input's sub-score; the figure is the points it added to the 100-point composite (weight × sub-score).
- Cash flow +27.9/30.0
- DSCR +9.9/10.0
- 1% rule +7.1/10.0
- Appreciation +6.0/10.0
- Rent growth +2.5/5.0
- Livability +2.5/5.0
- Condition / age +2.5/5.0
- ARV discount +2.1/15.0
- Schools +1.2/10.0
$120,000
🖨 Deal sheet 📄 Offer letter ✓ Due diligence
Listing remarks MLS
2 Bedroom Townhouse in Downtown St. Louis! Drive through the Security gate to your reserved parking spot next to your home. The parking lot can also accommodate additional cars. Hardwood floors can be found on the 1st floor with carpeting on the stairs and 2nd floor. A fenced area with a deck is available off the kitchen to enjoy the evening. A storage shed for additional personal items is available off the deck. The washer and dryer are conveniently located on the 2nd floor and will be left with the home. The unit is being sold as is. The owner will not make any repairs. Buyer to confirm the appropriate schools.
Key facts
- $50 HOA
- Parking
- Built 1988
Property features AI
Finance
- Other: Living area reported as 900 (public records); Address: 1111 Biddle St, Saint Louis, MO 63106; Neighborhood: Columbus Square; No home warranty; Seller may consider concessions
- HOA & community: HOA with outside management; Association fee $50 monthly; Association management present
Exterior
- Parking: 1 parking space; Assigned parking with guest and off-street spaces
- Utilities: Public water; Public sewer; Electric service by Ameren; Electricity connected; Natural gas connected; Water connected; Sewer connected
- Home design: Residential townhouse; Two levels; Slab foundation
- Construction: Cedar, frame and wood siding construction
- Exterior features: Deck; Storm door(s); Landscaped yard; Near public transit
Interior
- Kitchen: Kitchen (8 x 10)
- Bedrooms: 2 bedrooms (both on upper level)
- Flooring: Carpet; Vinyl
- Bathrooms: 1 full bathroom (on upper level)
- Heating & cooling: Forced air heating (natural gas); Central air conditioning (electric)
- Interior features: Stainless steel appliances; No fireplace; No basement
- Laundry & utility: Laundry room (3 x 6); Utility room (11 x 8)
Neighborhood map
What this means for you Summary
Snapshot
- This is a 2-bed/1.5-bath townhouse listed at $120k.
Deal economics
- At list price, monthly cash flow is $370 ($4k/yr) — positive.
- The deal already cash-flows at list — no discount required.
- Meets the 1% rule at list price ($1k rent vs $120k).
- Recommended offer: $118k (1.5% below list) — sets the bar for market timing.
- Cap rate 10.0% vs local median 5.0% in St. Louis — top-decile yield for the area; either an underpriced asset or a hidden risk that comps aren't pricing in. Stress-test before assuming the spread holds.
Location & tenants
- Location reads: area grade C — affects rentability + tenant quality, not the cash-flow math above.
- St. Louis City (urban): math 10% / reading 18% proficiency, ranked #312 of 324 in MO (top 96%) — low school quality limits family demand, transient renter base, plan for 1-2y turnover; 80% free/reduced lunch — lower-income household profile, screen leases tightly.
- Zoned schools: Henry Elem. (math 2% / reading 2%, grade F, #1,099 of 1,115 statewide, top 100%, 204 students, 98% FRL); Vashon High (math 2% / reading 2%, grade F, #520 of 521 statewide, top 100%, 568 students, 100% FRL) — zoned schools average 99% FRL vs 80% district-wide (18 pts higher); higher-poverty schools than district average — tighter screening recommended.
- Market conditions: 15 active listings in the ZIP; 40 comparable units currently listed for rent nearby; rentals leasing fast (median 8d on market — plan ~1-2 weeks tenant-placement turnaround); 294 units permitted in St. Louis city in 2024 (227 in 5+ unit buildings).
Forward outlook
- In year one you build about $3k of equity ($830 loan paydown + $2k appreciation (1.9% local appreciation)).
- St. Louis County population projected to shrink 6% by 2050 — rents likely to lag national; underwrite the cash flow, not the appreciation.
- At projected returns (1.9% appreciation + 3.0% rent growth), your $34k cash investment doubles in ~5 years — after that, you're playing with house money.
- By year 10, paydown + projected appreciation supports a ~$31k cash-out refi (75% LTV) — recoverable capital for the next deal without selling this one.
Negotiation context
- It's been on market 20 days — a 2% lower offer ($118k) is reasonable based on typical stale-listing flexibility.
- 4 sale attempts since 6y ago with the ask held roughly flat each time — persistent listings suggest the price (not the market) is what's stuck; bring a comps-based counter.
- Current owner paid $67k; list at $120k implies a 79% gain — meaningful room to come down on a strong offer.
Risks & watch-outs
- Climate carrying-cost: extreme-heat days projected 7→21/yr by 2055 (HVAC capex compounding) — expect insurance premiums to compound above CPI over the hold.
Questions for the listing agent
- What does the HOA fee cover, when was the last increase, and are there any pending special assessments or reserve-fund shortfalls?
- Is there a deadline driving the sale (1031 exchange, divorce, estate, relocation)? That informs how much negotiation room exists.
- What's the average days-on-market for RENTAL listings here right now (not sales)? A rising rental-DOM trend means longer vacancies and softer asking-rent achievability than the comps imply.
- What's the recent tenant-quality profile in this submarket — average credit score on applications, eviction rate, late-payment / NSF rate, and stable-employment percentage? A property-management company in the area should have these aggregated.
- How much new for-sale + rental construction is in the pipeline within 1–3 miles? Heavy new supply typically softens prices + rents 12–24 months out; constrained supply supports both.
Investment metrics
- 1% rule
- 1.21% ✓
- Cap rate
- 9.99%
- Cash-on-cash
- 13.21%
- DSCR
- 1.59
- GRM
- 6.9
CMA / ARV
- ARV (on-the-fly)
- $107,100
- Comps found
- 12
Show comp detail 12 sales within ~0.75 mi
| Address | Dist | Beds/Ba | Sqft | Sold | Price | $/sf | Match |
|---|---|---|---|---|---|---|---|
| 1520 Washington Unit #327 Ave | 0.58mi | 1/1.0 (-1) | 900 (0%) | 8mo | $74,500 | $83 | 59 |
| 314 N Broadway #1808 | 0.67mi | 2/1.5 | 937 (+4%) | 10mo | $159,900 | $171 | 54 |
| 507 N 13th St #207 | 0.47mi | 1/1.0 (-1) | 986 (+10%) | 4mo | $79,900 | $81 | 52 |
| 1501 Locust St #202 | 0.58mi | 1/1.0 (-1) | 980 (+9%) | 2mo | $125,000 | $128 | 49 |
| 507 N 13th St #301 | 0.47mi | 1/1.0 (-1) | 800 (-11%) | 5mo | $94,900 | $119 | 49 |
| 507 N 13th St #407 | 0.47mi | 1/1.0 (-1) | 972 (+8%) | 12mo | $99,900 | $103 | 48 |
| 210 N 17th St #702 | 0.74mi | 2/1.0 | 814 (-10%) | 4mo | $74,900 | $92 | 45 |
| 210 N 17th St #901 | 0.74mi | 2/1.0 | 814 (-10%) | 5mo | $56,000 | $69 | 43 |
| 210 N 17th St #302 | 0.74mi | 2/1.0 | 814 (-10%) | 8mo | $54,000 | $66 | 41 |
| 507 N 13th St #203 | 0.47mi | 1/1.0 (-1) | 1,019 (+13%) | 12mo | $145,000 | $142 | 40 |
| 314 Broadway #1005 | 0.67mi | 1/1.0 (-1) | 796 (-12%) | 6mo | $117,900 | $148 | 38 |
| 314 N Broadway #1804 | 0.67mi | 2/1.0 | 787 (-13%) | 11mo | $134,900 | $171 | 36 |
Match score weights: distance 35% · size 25% · config 20% · recency 20%. Top-matched comps best support the ARV.
Projected returns pro-forma
1.91% appreciation · 3.0% rent growth · sell at horizon
- IRR
- 17.3%
- Equity multiple
- 1.93×
- Total profit
- $31,199
- Equity at exit
- $46,727
- IRR
- 19.7%
- Equity multiple
- 3.59×
- Total profit
- $86,913
- Equity at exit
- $66,827
Cash invested: $33,600 (down + closing). Projections, not guarantees.
Landlord ↔ Tenant lean methodology
- Overall (STATE)
- 81 Strongly Landlord-Friendly
- State Missouri
- 81 Strongly Landlord-Friendly · R+10
- County
- — inherits STATE
- City
- — inherits STATE
ZIP-level market 63106
- Home prices YoY
- 1.4%
- Active inventory
- 15
- Price-to-rent
- 6.9×
Monthly cashflow live
- Estimated rent
- $1,452 high interval (Pro) →
- Mortgage (P&I)
- −$629
- Tax from tax record
- −$48 /mo · $577/yr
- Insurance
- −$50
- HOA
- −$50
- Vacancy / Maint / Mgmt
- −$305
- Net cashflow
- $370
Break-even live
UW: 25.0% down · 7.5% · 30yr · 1.5% tax · 5.0% vac · 8.0% maint · 8.0% mgmt
Financing live
Cash to close
- Down payment
- $30,000
- Closing costs
- $3,600
- Reserves months
- —
- Total cash needed
- —
Loan-product check · same deal, 3 products live
Conventional
25% down · 7.5% · 30yr
- Down + closing
- —
- Monthly P&I
- —
- Monthly cashflow
- —
- DSCR
- —
- Eligible?
- —
Personal DTI + credit; lowest rate.
DSCR
20% down · 8.5% · 30yr
- Down + closing
- —
- Monthly P&I
- —
- Monthly cashflow
- —
- DSCR
- —
- Eligible?
- —
No personal income docs; deal must DSCR.
Hard money
10% down · 12.0% · 12mo
- Down + closing
- —
- Monthly P&I
- —
- Monthly cashflow
- —
- DSCR
- —
- Eligible?
- —
Short-term bridge; refi at stabilization.
Rent comps 40 comps
| Address | Beds | Baths | Sqft | Rent | $/sqft | DOM | Units | Dist |
|---|---|---|---|---|---|---|---|---|
| 1115 Carr St St. Louis, MO | 1.0–2.0 | 1.0 | 747 | $1,123 | $1.50 | 4d | 13 | 0.08mi |
| 1204 N 8th St St. Louis, MO | 1.0–3.0 | 1.0 | 740 | $869 | $1.17 | 1d | 19 | 0.20mi |
| 1300 Convention Plz Saint Louis, MO | 2.0 | 1.0 | 877 | $1,350 | $1.54 | 43d | 1 | 0.35mi |
| 1133 Washington Ave St. Louis, MO | 2.0 | 1.0–2.0 | 637 | $1,292 | $2.03 | 43d | 1 | 0.39mi |
| 1110 Washington Ave Saint Louis, MO | 1.0–2.0 | 1.0–2.0 | 1006 | $1,426 | $1.42 | 2d | 19 | 0.41mi |
| 1000 Washington Ave Saint Louis, MO | 1.0–2.0 | 1.0–2.0 | 959 | $1,950 | $2.03 | 1d | 24 | 0.42mi |
| 1307 Washington Ave St. Louis, MO | 1.0–2.0 | 1.0 | 1261 | $1,485 | $1.18 | 7d | 17 | 0.44mi |
| 917 Locust St St. Louis, MO | 1.0 | 1.0 | 683 | $1,305 | $1.91 | 16d | 3 | 0.48mi |
| 1014 Locust St Saint Louis, MO | 1.0–2.0 | 1.0–2.0 | 1110 | $2,070 | $1.86 | 1d | 2 | 0.50mi |
| 1531 Washington Ave St. Louis, MO | 1.0–2.0 | 1.0 | 656 | $1,609 | $2.45 | 1d | 5 | 0.53mi |
| 300 N Tucker Blvd St. Louis, MO | 1.0–2.0 | 1.0–2.0 | 1013 | $1,875 | $1.85 | 1d | 10 | 0.53mi |
| 300 N Tucker Blvd Apt 406 St. Louis, MO | 1.0 | 1.0 | 834 | $1,250 | $1.50 | 14d | 1 | 0.53mi |
| 1226 Olive St St. Louis, MO | 1.0–2.0 | 1.0–2.0 | 1157 | $1,700 | $1.47 | 1d | 2 | 0.59mi |
| 1501 Locust St Saint Louis, MO | 1.0 | 1.0 | 1002 | $1,200 | $1.20 | 43d | 1 | 0.59mi |
| 555 N 4th St St. Louis, MO | 1.0–2.0 | 1.0–1.5 | 1180 | $1,775 | $1.50 | 43d | 12 | 0.60mi |
| 555 N 4th St St. Louis, MO | 2.0 | 1.0 | 1080 | $1,450 | $1.34 | 16d | 1 | 0.60mi |
| 206 N 9th St Unit 502 St. Louis, MO | 1.0 | 1.0 | 626 | $895 | $1.43 | 43d | 1 | 0.60mi |
| 206 N 9th St Unit 509 St. Louis, MO | 1.0 | 1.0 | 701 | $925 | $1.32 | 43d | 1 | 0.60mi |
| 206 N 9th St Unit 307 St. Louis, MO | 2.0 | 1.0 | 897 | $1,100 | $1.23 | 4d | 1 | 0.60mi |
| 206 N 9th St Unit 1306 St. Louis, MO | 2.0 | 2.0 | 897 | $1,250 | $1.39 | 43d | 1 | 0.60mi |
| 206 N 9th St Unit 1207 St. Louis, MO | 2.0 | 1.0 | 843 | $1,100 | $1.30 | 43d | 1 | 0.60mi |
| 206 N 9th St Unit 811 St. Louis, MO | 1.0 | 1.0 | 633 | $895 | $1.41 | 7d | 1 | 0.60mi |
| 206 N 9th St Unit 916 St. Louis, MO | 2.0 | 2.0 | 914 | $1,250 | $1.37 | 23d | 1 | 0.60mi |
| 206 N 9th St Unit 514 St. Louis, MO | 1.0 | 1.0 | 675 | $975 | $1.44 | 43d | 1 | 0.60mi |
| 206 N 9th St Unit 712 St. Louis, MO | 1.0 | 1.0 | 783 | $925 | $1.18 | 7d | 1 | 0.60mi |
| 1635 Washington Ave Saint Louis, MO | 1.0–2.0 | 1.0 | 1135 | $1,495 | $1.32 | 3d | 4 | 0.60mi |
| 800 Olive St Saint Louis, MO | 1.0–2.0 | 1.0–2.0 | 1063 | $2,319 | $2.18 | 1d | 26 | 0.60mi |
| 720 Olive St St. Louis, MO | 3.0 | 1.0–2.0 | 1778 | $3,723 | $2.09 | 1d | 15 | 0.62mi |
| 515 Olive St Saint Louis, MO | 1.0–2.0 | 1.0–2.5 | 1117 | $3,100 | $2.78 | 1d | 26 | 0.64mi |
| 1405 Pine St St. Louis, MO | 2.0 | 2.0 | 1020 | $1,240 | $1.22 | 3d | 1 | 0.65mi |
| 1706 Washington Ave St. Louis, MO | 1.0–2.0 | 1.0–2.0 | 997 | $1,761 | $1.77 | 1d | 10 | 0.66mi |
| 618 N 2nd St Unit 405 St. Louis, MO | 1.0 | 1.0 | 744 | $1,266 | $1.70 | 14d | 1 | 0.67mi |
| 618 N 2nd St Unit 501 St. Louis, MO | 1.0 | 1.0 | 780 | $1,386 | $1.78 | 14d | 1 | 0.67mi |
| 618 N 2nd St Apt 409 St. Louis, MO | 1.0 | 1.0 | 875 | $1,480 | $1.69 | 14d | 1 | 0.67mi |
| 700 N 2nd St Saint Louis, MO | 1.0 | 1.0 | 654 | $1,378 | $2.10 | 19d | 5 | 0.68mi |
| 400 N 4th St Saint Louis, MO | 2.0 | 1.0–2.0 | 1162 | $3,160 | $2.72 | 1d | 1 | 0.68mi |
| 618 N 2nd St Saint Louis, MO | 1.0 | 1.0 | 791 | $1,545 | $1.95 | 19d | 4 | 0.68mi |
| 701 N 1st St St. Louis, MO | 1.0–2.0 | 1.0 | 894 | $1,990 | $2.23 | 1d | 8 | 0.69mi |
| 1800 Washington Ave Saint Louis, MO | 1.0–2.0 | 1.0–2.0 | 927 | $1,645 | $1.77 | 43d | 13 | 0.72mi |
| 1901 Washington Ave Saint Louis, MO | 1.0–2.0 | 1.0–2.0 | 1076 | $1,500 | $1.39 | 4d | 38 | 0.75mi |
HOA detail
- Monthly dues
- $50 · $600/yr
- Likely covers
- security
Listing history 14 events
-
2026-06-19status $120,000 Pending 20 DOM
-
2026-06-18days on market $120,000 Active 20 DOM
-
2026-06-17days on market $120,000 Active 19 DOM
-
2026-06-16days on market $120,000 Active 18 DOM
-
2026-06-15days on market $120,000 Active 17 DOM
-
2026-06-13days on market $120,000 Active 15 DOM
-
2026-06-09days on market $120,000 Active 11 DOM
-
2026-06-08days on market $120,000 Active 10 DOM
-
2026-06-07days on market $120,000 Active 9 DOM
-
2026-06-05days on market $120,000 Active 6 DOM
-
2026-06-03days on market $120,000 Active 5 DOM
-
2026-06-02days on market $120,000 Active 4 DOM
-
2026-06-01days on market $120,000 Active 3 DOM
-
2026-05-31days on market $120,000 Active 2 DOM
ⓘ Source: listings_history table (triggers on properties + properties_extension) + one-shot
backfill from property_details.listing_events for pre-trigger history.
Tax reassessment forecast MO · Resets to sale price
- Current annual tax
- $577 · $48/mo
- Projected year-2 tax
- $1,164 · $97/mo
- Expected delta
- +$587/yr (+$49/mo · 101.7%)
ⓘ Screening estimate from a state-policy table — verify with the county assessor before closing.
Climate risk First Street
- Flood 1/10 Low FEMA zone X (unshaded) · 0% chance over 30 yrs
- Wildfire 1/10 Low
- Heat 5/10 Major 7 d/yr ≥109°F today · 21 d/yr by 30 yrs out
- Wind 2/10 Low 100% chance of damaging wind over 30 yrs
- Air quality 3/10 Moderate 3 unhealthy d/yr today · 4 by 30 yrs out
Nearby sold comps map
Loading sold comps map…
Walkable amenities ~0.75 mi
Loading nearby amenities…
Taxation est. · year 1
- Rental income
- $17,425
- − Mortgage interest
- −$6,722
- − Property taxes
- −$577
- − Insurance
- −$600
- − Repairs & maintenance
- −$1,394
- − Management
- −$1,394
- − HOA
- −$600
- − Depreciation
- −$3,491
- Taxable income
- $2,647
- Est. tax owed @ 24.0%
- −$635
- After-tax cash flow
- $3,802/yr
For passive investors: Depreciation is non-cash, so a rental often shows a tax loss while cash-flowing — sheltering income. Rental losses are passive: they offset passive income freely, and up to $25,000/yr can offset ordinary (W-2) income if you actively participate and your MAGI is under $100k (phasing out to $0 by $150k); unused losses carry forward. On sale, claimed depreciation is recaptured at up to 25%, and gains may owe capital-gains tax (a 1031 exchange can defer both). Figures are a year-1 estimate at your 24.0% rate — not tax advice; consult a CPA.
Schools (NCES district)
- District
- St. Louis City
- NCES district ID
- 2929280
- Math proficiency
- 10% ▼ -6.00%
- Reading proficiency
- 18% ▼ -3.00%
- Median HH income
- $35,685
- Composite
- 11.54/100
- National rank
- #9699
- State rank
- #312 of 324 in MO
Livability — St. Louis
No livability data for this city. (Only ~50 U.S. cities are tracked.)
Census & demographics
- Census place
- St. Louis, MO
- City population
- 283,259
- Population (ZIP)
- 7,742
Population outlook (St. Louis County) Hauer SSP2
- Today (2025)
- 315,737 people
- By 2030
- 313,865 · -0.6%
- By 2040
- 305,439 · -3.3%
- By 2050
- 296,529 · -6.1%
- By 2075
- 271,028 · -14.2%
- By 2100
- 255,359 · -19.1%
Race, ethnicity, and origin ACS 2023
- Neighborhood character
- Predominantly Black (89%)
- Race & ethnicity
- Black 89% White 7% Two or more races 2% Hispanic / Latino 2%
- Foreign-born
- 5% · Canada
- Languages at home
- 93% English-only · Spanish 2%
Political lean MEDSL · St. Louis
- 2024 margin
- Solid D (+64.7) · D 81.4% · R 16.7% · Other 2.0%
- 2008→2024 swing
- -3.5pp toward R · 2008: 68.2pp · 2024: 64.7pp
- All cycles
- 2024: D+64.7 2020: D+66.2 2016: D+63.7 2012: D+66.6 2008: D+68.2
Not yet ingested
- Civics
- —
Market trends
- HPI YoY
- ▲ 1.91%
- Current HPI
- 133.284
- Rent YoY
- —
- Metro
- —
- State GDP YoY
- ▲ 1.84%
- F500 in state
- 20
Industry mix (Fortune 500 HQ in MO)
| Industry | F500 HQs | Revenue |
|---|---|---|
| Healthcare | 1 | $163B |
|
||
| Insurance | 1 | $21B |
|
||
| Industrial Technology | 1 | $17B |
|
||
| Retail | 1 | $16B |
|
||
| Industrial Distribution | 1 | $10B |
|
||
| Utilities | 1 | $9B |
|
||
Price history
+81.8% since first listed14 events — show timeline
- 2026-05-30 Listed $120,000 MARIS as Distributed by MLS Grid
- 2026-05-29 Coming Soon $120,000 MARIS as Distributed by MLS Grid
- 2026-05-23 Rental Removed $1,295 BUILDIUM
- 2026-04-15 Price Changed $1,295 BUILDIUM
- 2026-03-25 Listed for Rent $1,395 BUILDIUM
- 2023-02-02 Sold (Public Records) $67,000 Public Records
- 2023-01-31 Sold (MLS) — MARIS as Distributed by MLS Grid
- 2023-01-02 Pending — MARIS as Distributed by MLS Grid
- 2022-11-04 Listed $90,000 MARIS as Distributed by MLS Grid
- 2020-11-13 Sold (Public Records) $73,000 Public Records
- 2020-11-03 Sold (MLS) — MARIS as Distributed by MLS Grid
- 2020-10-05 Pending — MARIS as Distributed by MLS Grid
- 2020-09-25 Listed $80,000 MARIS as Distributed by MLS Grid
- 2003-02-13 Sold (Public Records) $66,000 Public Records
Property tax history
+3.3%/yrLatest (2024): $577 · +24.8% YoY. Source: county tax records.
Cash-flow waterfall
monthlySold comps — $/sqft
last 12 mo · ≤1 miLoading sold comps…