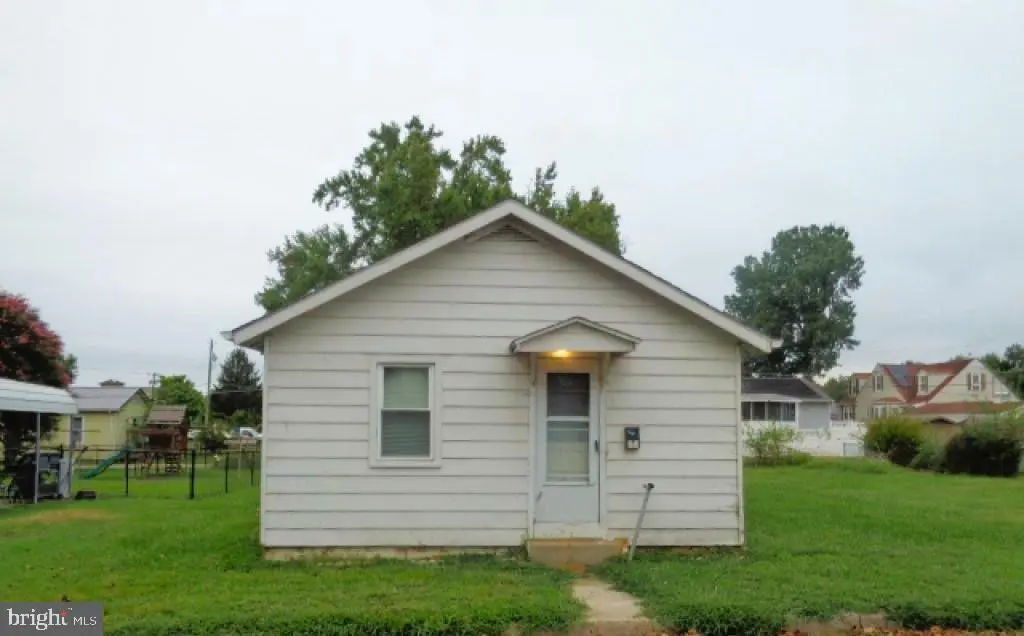
82 Castle Heights Ave
Pennsville, NJ 08070
$136,250B
2 bd · 1.0 ba ·
874 sqft ·
Built 1930
· SingleFamily
· Pending
· 30 DOM
Cashflow @ list (25.0% down · 7.5%)
Estimated rent
$1,956/mo
Mortgage (P&I)
−$715
Tax + insurance
−$895
HOA
−$0
Vac / Maint / Mgmt
−$411
Net cashflow
$-65/mo
Annual
$-777/yr
Cap rate
9.48%
Cash-on-cash
11.38%
DSCR
1.51
1% rule
1.44%
Cash to close
$38,150
Investor read
- This is a 2-bed/1.0-bath single-family listed at $136k.
- At list price, monthly cash flow is $-65 ($-777/yr) — negative.
- To cash-flow at today's rent, offer at most $125k (8.4% below list).
- Meets the 1% rule at list price ($2k rent vs $136k).
- It's been on market 30 days — a 2% lower offer ($134k) is reasonable based on typical stale-listing flexibility.
- Recommended offer: $125k (8.4% below list) — sets the bar for cash-flow.
- Local home prices are declining (-3.0%/yr); year-one equity from $942 of loan paydown is wiped out by about $4k of value loss. Plan a longer hold.
- Location reads 72/100 on livability (#225 in NJ) — a middle-class / working-renter tenant base. Strengths: housing A+, health & safety A+, cost of living A-; Watch: amenities F, commute F.
- Pennsville Public School District (suburban): math 12% / reading 45% proficiency, ranked #356 of 472 in NJ (top 75%) — low school quality limits family demand, transient renter base, plan for 1-2y turnover.
- Zoned schools: Penn Beach Elementary (math 10% / reading 48%, grade F, #766 of 1,303 statewide, top 59%, 316 students, 43% FRL); Pennsville Memorial High School (math 17% / reading 42%, grade F, #290 of 399 statewide, top 74%, 462 students, 29% FRL).
- Watch-outs: property tax is 3.6% of price; flood insurance adds $427/mo; built in 1930 — expect roof / HVAC / electrical / plumbing capex.
- Market conditions: 84 active listings in the ZIP; 3 comparable units currently listed for rent nearby; rentals leasing fast (median 2d on market — plan ~1-2 weeks tenant-placement turnaround); 95 units permitted in Salem County in 2024 (0 in 5+ unit buildings).
- Salem County population projected at -23% by 2050 — secular population decline; favor cash flow + early exit over multi-decade hold.
- 6 sale attempts since 9y ago with the ask held roughly flat each time — persistent listings suggest the price (not the market) is what's stuck; bring a comps-based counter.
- Climate carrying-cost: in FEMA flood zone AE (mandatory federal flood insurance); major wind risk, 27% chance of damaging wind over 30y; extreme-heat days projected 7→15/yr by 2055 (HVAC capex compounding) — expect insurance premiums to compound above CPI over the hold.
- Cap rate 9.5% vs local median 3.6% in Pennsville — top-decile yield for the area; either an underpriced asset or a hidden risk that comps aren't pricing in. Stress-test before assuming the spread holds.
Questions for listing agent
- What do current leases actually rent for vs. the listed asking? Can we see a recent rent roll and the last 12 months of T-12 income?
- Built in 1930 — when were the roof, HVAC, electrical panel, plumbing, and water heater last replaced?
- Property tax is high relative to price — has the assessment been appealed recently, and will the sale trigger a re-assessment?
- What's the actual annual flood-insurance premium (NFIP or private), and is the property in a SFHA with mandatory coverage?
- Is there a deadline driving the sale (1031 exchange, divorce, estate, relocation)? That informs how much negotiation room exists.
- What's the average days-on-market for RENTAL listings here right now (not sales)? A rising rental-DOM trend means longer vacancies and softer asking-rent achievability than the comps imply.
- What's the recent tenant-quality profile in this submarket — average credit score on applications, eviction rate, late-payment / NSF rate, and stable-employment percentage? A property-management company in the area should have these aggregated.
- How much new for-sale + rental construction is in the pipeline within 1–3 miles? Heavy new supply typically softens prices + rents 12–24 months out; constrained supply supports both.
CashFlowRE · CFR-WGGXT722QBFKDP
· Data 3 weeks ago
cashflowre.app · 2026-05-29