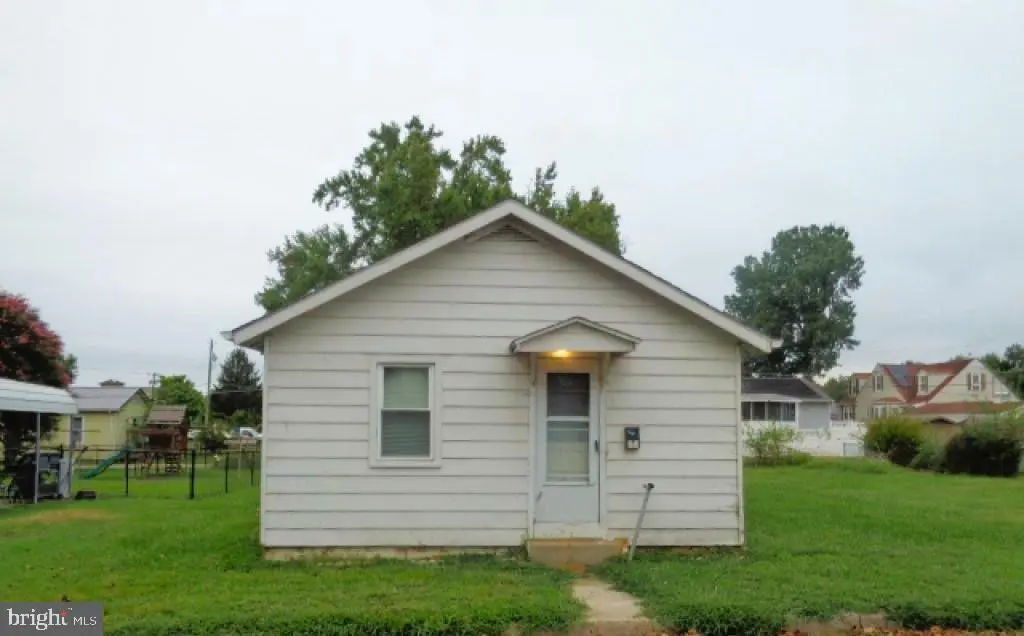
82 Castle Heights Ave · Pennsville, NJ
Flood risk 10/10 · Severe
- FEMA flood zone
- AE
- Chance of flooding over 30 yrs
- 0.99%
- Est. flood insurance / yr
- $1,737 – $8,500
Fire risk 1/10 · Minimal
- Est. fire insurance / yr
- $526 – $976
Heat risk 8/10 · Major
- Hot days now (above 102°F)
- 7 days/yr
- Hot days in 30 yrs
- 15 days/yr
Wind risk 6/10 · Moderate
- Chance of severe wind over 30 yrs
- 27.0%
Air-quality risk 3/10 · Minor
- Unhealthy air days now
- 3 days/yr
- Unhealthy air days in 30 yrs
- 5 days/yr
Risk factors via First Street. Map © Google.
Why this score? — see what drove the B grade
The composite is a weighted blend of 9 inputs, each scored 0–100. Each bar is that input's sub-score; the figure is the points it added to the 100-point composite (weight × sub-score).
- Cash flow +26.5/30.0
- ARV discount +15.0/15.0
- 1% rule +9.4/10.0
- DSCR +9.1/10.0
- Livability +3.6/5.0
- Schools +2.6/10.0
- Rent growth +2.5/5.0
- Condition / age +2.5/5.0
- Appreciation +0.0/10.0
$136,250
🖨 Deal sheet 📄 Offer letter ✓ Due diligence
Listing remarks MLS
Opportunity awaits with this charming 2 bedroom, 1 bath home offering 874 square feet of living space. Situated on a generously sized lot, the property features a large yard, perfect for outdoor entertaining, gardening, or future expansion. Inside, the home offers a functional layout with great potential to customize and make it your own. Whether you're an investor, first time buyer, or someone looking for a renovation project, this property is a fantastic canvas to bring your vision to life. Conveniently located near local amenities, shopping, and major commuting routes, this home combines location, value, and opportunity. With a little TLC, this could be the perfect place to call home or a smart addition to your investment portfolio
Key facts
- Generously sized lot
- Large yard
- Functional layout
Tags
Property features AI
Finance
- Other: Ground rent payment frequency: annually
Exterior
- Parking: Driveway; Off-street parking
- Utilities: Public water; Public sewer; Electric service available; Cable TV available; Phone service available; 60+ gallon hot water tank
- Home design: Detached structure; Shingle roof; Frame construction; Slab foundation; Building winterized; Fee simple ownership; Average condition; Built year source: Assessor
- Construction: Frame construction; Slab foundation; Shingle roof; Detached
- Exterior features: Lot approximately 85 x 100; Above-grade and below-grade structures listed
Interior
- Kitchen: Electric oven/range; Refrigerator
- Bedrooms: 2 bedrooms on the main level
- Flooring: Carpet; Tile/brick; Vinyl
- Bathrooms: 1 full bathroom on the main level
- Heating & cooling: Forced air heating (electric); Ceiling fans; Window air conditioning units
- Interior features: Breakfast area; Combination kitchen/dining; Drywall walls and ceilings; No basement; 5 total rooms
Neighborhood map
What this means for you Summary
Snapshot
- This is a 2-bed/1.0-bath single-family listed at $136k.
Deal economics
- At list price, monthly cash flow is $-65 ($-777/yr) — negative.
- To cash-flow at today's rent, offer at most $125k (8.4% below list).
- Meets the 1% rule at list price ($2k rent vs $136k).
- Recommended offer: $125k (8.4% below list) — sets the bar for cash-flow.
- Cap rate 9.5% vs local median 3.6% in Pennsville — top-decile yield for the area; either an underpriced asset or a hidden risk that comps aren't pricing in. Stress-test before assuming the spread holds.
Location & tenants
- Location reads 72/100 on livability (#225 in NJ) — a middle-class / working-renter tenant base. Strengths: housing A+, health & safety A+, cost of living A-; Watch: amenities F, commute F.
- Pennsville Public School District (suburban): math 12% / reading 45% proficiency, ranked #356 of 472 in NJ (top 75%) — low school quality limits family demand, transient renter base, plan for 1-2y turnover.
- Zoned schools: Penn Beach Elementary (math 10% / reading 48%, grade F, #766 of 1,303 statewide, top 59%, 316 students, 43% FRL); Pennsville Memorial High School (math 17% / reading 42%, grade F, #290 of 399 statewide, top 74%, 462 students, 29% FRL).
- Market conditions: 84 active listings in the ZIP; 3 comparable units currently listed for rent nearby; rentals leasing fast (median 2d on market — plan ~1-2 weeks tenant-placement turnaround); 95 units permitted in Salem County in 2024 (0 in 5+ unit buildings).
Forward outlook
- Local home prices are declining (-3.0%/yr); year-one equity from $942 of loan paydown is wiped out by about $4k of value loss. Plan a longer hold.
- Salem County population projected at -23% by 2050 — secular population decline; favor cash flow + early exit over multi-decade hold.
Negotiation context
- It's been on market 30 days — a 2% lower offer ($134k) is reasonable based on typical stale-listing flexibility.
- 6 sale attempts since 9y ago with the ask held roughly flat each time — persistent listings suggest the price (not the market) is what's stuck; bring a comps-based counter.
Risks & watch-outs
- Watch-outs: property tax is 3.6% of price; flood insurance adds $427/mo; built in 1930 — expect roof / HVAC / electrical / plumbing capex.
- Climate carrying-cost: in FEMA flood zone AE (mandatory federal flood insurance); major wind risk, 27% chance of damaging wind over 30y; extreme-heat days projected 7→15/yr by 2055 (HVAC capex compounding) — expect insurance premiums to compound above CPI over the hold.
Questions for the listing agent
- What do current leases actually rent for vs. the listed asking? Can we see a recent rent roll and the last 12 months of T-12 income?
- Built in 1930 — when were the roof, HVAC, electrical panel, plumbing, and water heater last replaced?
- Property tax is high relative to price — has the assessment been appealed recently, and will the sale trigger a re-assessment?
- What's the actual annual flood-insurance premium (NFIP or private), and is the property in a SFHA with mandatory coverage?
- Is there a deadline driving the sale (1031 exchange, divorce, estate, relocation)? That informs how much negotiation room exists.
- What's the average days-on-market for RENTAL listings here right now (not sales)? A rising rental-DOM trend means longer vacancies and softer asking-rent achievability than the comps imply.
- What's the recent tenant-quality profile in this submarket — average credit score on applications, eviction rate, late-payment / NSF rate, and stable-employment percentage? A property-management company in the area should have these aggregated.
- How much new for-sale + rental construction is in the pipeline within 1–3 miles? Heavy new supply typically softens prices + rents 12–24 months out; constrained supply supports both.
Investment metrics
- 1% rule
- 1.44% ✓
- Cap rate
- 9.48%
- Cash-on-cash
- 11.38%
- DSCR
- 1.51
- GRM
- 5.8
CMA / ARV
- ARV (on-the-fly)
- $219,374
- Comps found
- 12
Show comp detail 12 sales within ~0.75 mi
| Address | Dist | Beds/Ba | Sqft | Sold | Price | $/sf | Match |
|---|---|---|---|---|---|---|---|
| 58 Oak St | 0.31mi | 2/1.0 | 884 (+1%) | 3mo | $210,000 | $238 | 81 |
| 13 Park Ave | 0.20mi | 2/1.0 | 864 (-1%) | 15mo | $209,000 | $242 | 76 |
| 105 Castle Heights Ave | 0.10mi | 3/1.0 (+1) | 836 (-4%) | 9mo | $210,000 | $251 | 75 |
| 19 Miramar Dr | 0.20mi | 3/1.0 (+1) | 895 (+2%) | 11mo | $225,000 | $251 | 72 |
| 25 Elizabeth Dr | 0.34mi | 2/1.0 | 837 (-4%) | 8mo | $245,000 | $293 | 71 |
| 112 Highland Ave | 0.11mi | 3/1.0 (+1) | 970 (+11%) | 2mo | $250,000 | $258 | 70 |
| 9 University Dr | 0.34mi | 2/1.0 | 934 (+7%) | 13mo | $210,000 | $225 | 62 |
| 103 Dunn Ln | 0.19mi | 2/1.0 | 749 (-14%) | 12mo | $200,000 | $267 | 57 |
| 10 Morningside Dr | 0.57mi | 3/1.0 (+1) | 960 (+10%) | 11mo | $250,000 | $260 | 43 |
| 123 Illinois Rd | 0.63mi | 2/2.0 | 832 (-5%) | 22mo | $250,000 | $300 | 40 |
| 62 Cornell Rd | 0.68mi | 1/1.0 (-1) | 752 (-14%) | 22mo | $149,777 | $199 | 22 |
| 71 Morningside Dr | 0.71mi | 3/1.0 (+1) | 1,000 (+14%) | 21mo | $220,000 | $220 | 20 |
Match score weights: distance 35% · size 25% · config 20% · recency 20%. Top-matched comps best support the ARV.
Projected returns pro-forma
-3.0% appreciation · 3.0% rent growth · sell at horizon
- IRR
- -19.2%
- Equity multiple
- 0.32×
- Total profit
- $-25,762
- Equity at exit
- $20,315
- IRR
- -11.1%
- Equity multiple
- 0.32×
- Total profit
- $-25,956
- Equity at exit
- $11,780
Cash invested: $38,150 (down + closing). Projections, not guarantees.
Landlord ↔ Tenant lean methodology
- Overall (STATE)
- 21 Tenant-Leaning
- State New Jersey
- 21 Tenant-Leaning · D+6
- County
- — inherits STATE
- City
- — inherits STATE
ZIP-level market 08070
- Home prices YoY
- -23.7%
- Active inventory
- 84
- Price-to-rent
- 5.8×
Monthly cashflow live
- Estimated rent
- $1,956 medium interval (Pro) →
- Mortgage (P&I)
- −$715
- Tax from tax record
- −$412 /mo · $4,944/yr
- Insurance
- −$57
- Flood insurance flood zone
- −$427 /mo · $5,118/yr
- HOA
- −$0
- Vacancy / Maint / Mgmt
- −$411
- Net cashflow
- $-65
Break-even live
UW: 25.0% down · 7.5% · 30yr · 1.5% tax · 5.0% vac · 8.0% maint · 8.0% mgmt
Financing live
Cash to close
- Down payment
- $34,062
- Closing costs
- $4,088
- Reserves months
- —
- Total cash needed
- —
Loan-product check · same deal, 3 products live
Conventional
25% down · 7.5% · 30yr
- Down + closing
- —
- Monthly P&I
- —
- Monthly cashflow
- —
- DSCR
- —
- Eligible?
- —
Personal DTI + credit; lowest rate.
DSCR
20% down · 8.5% · 30yr
- Down + closing
- —
- Monthly P&I
- —
- Monthly cashflow
- —
- DSCR
- —
- Eligible?
- —
No personal income docs; deal must DSCR.
Hard money
10% down · 12.0% · 12mo
- Down + closing
- —
- Monthly P&I
- —
- Monthly cashflow
- —
- DSCR
- —
- Eligible?
- —
Short-term bridge; refi at stabilization.
Rent comps 3 comps
| Address | Beds | Baths | Sqft | Rent | $/sqft | DOM | Units | Dist |
|---|---|---|---|---|---|---|---|---|
| 10 Jefferson Rd Pennsville, NJ | 2.0 | 1.0 | 816 | $2,200 | $2.70 | 1d | 1 | 1.15mi |
| 10 Jefferson Rd Pennsville, NJ | 2.0 | 1.0 | 816 | $2,200 | $2.70 | 10d | 1 | 1.15mi |
| 20 Fort Sumpter Rd Pennsville, NJ | 1.0 | 1.0 | 720 | $1,235 | $1.72 | 1d | 2 | 1.50mi |
Listing history 21 events
-
2026-05-21status Under Contract 746-char remark
Show marketing remark (746 chars)
Opportunity awaits with this charming 2 bedroom, 1 bath home offering 874 square feet of living space. Situated on a generously sized lot, the property features a large yard, perfect for outdoor entertaining, gardening, or future expansion. Inside, the home offers a functional layout with great potential to customize and make it your own. Whether you're an investor, first time buyer, or someone looking for a renovation project, this property is a fantastic canvas to bring your vision to life. Conveniently located near local amenities, shopping, and major commuting routes, this home combines location, value, and opportunity. With a little TLC, this could be the perfect place to call home or a smart addition to your investment portfolio
-
2026-05-20status Pending
-
2026-04-20$136,250 Active 746-char remark
Show marketing remark (746 chars)
Opportunity awaits with this charming 2 bedroom, 1 bath home offering 874 square feet of living space. Situated on a generously sized lot, the property features a large yard, perfect for outdoor entertaining, gardening, or future expansion. Inside, the home offers a functional layout with great potential to customize and make it your own. Whether you're an investor, first time buyer, or someone looking for a renovation project, this property is a fantastic canvas to bring your vision to life. Conveniently located near local amenities, shopping, and major commuting routes, this home combines location, value, and opportunity. With a little TLC, this could be the perfect place to call home or a smart addition to your investment portfolio
-
2026-04-20$136,250 Active
Show marketing remark (746 chars)
Opportunity awaits with this charming 2 bedroom, 1 bath home offering 874 square feet of living space. Situated on a generously sized lot, the property features a large yard, perfect for outdoor entertaining, gardening, or future expansion. Inside, the home offers a functional layout with great potential to customize and make it your own. Whether you're an investor, first time buyer, or someone looking for a renovation project, this property is a fantastic canvas to bring your vision to life. Conveniently located near local amenities, shopping, and major commuting routes, this home combines location, value, and opportunity. With a little TLC, this could be the perfect place to call home or a smart addition to your investment portfolio
-
2024-08-23soldstatus $195,000
-
2024-04-20historical
-
2024-04-08price $159,000
-
2024-03-25$165,000 Active
-
2018-04-30soldstatus $33,325 Sold
-
2018-04-30soldstatus $33,325 Closed
-
2018-04-28status Pending
-
2018-04-28status Under Contract
-
2018-01-07price $40,000
-
2017-11-12status Active
-
2017-11-07historical
-
2017-08-30price $50,000
-
2017-07-10price $55,000
-
2017-06-07$75,000 Active
-
2017-06-04$40,000 Active
-
1993-06-24soldstatus $67,000
-
1990-10-26soldstatus $55,000
ⓘ Source: listings_history table (triggers on properties + properties_extension) + one-shot
backfill from property_details.listing_events for pre-trigger history.
Tax reassessment forecast NJ · Partial reset (capped growth)
- Current annual tax
- $4,944 · $412/mo
- Projected year-2 tax
- $4,944 · $412/mo
- Expected delta
- $0/yr ($0/mo · 0.0%)
ⓘ Screening estimate from a state-policy table — verify with the county assessor before closing.
Climate risk First Street
- Flood 10/10 Extreme FEMA zone AE · 99% chance over 30 yrs
- Wildfire 1/10 Low
- Heat 8/10 Severe 7 d/yr ≥102°F today · 15 d/yr by 30 yrs out
- Wind 6/10 Major 27% chance of damaging wind over 30 yrs
- Air quality 3/10 Moderate 3 unhealthy d/yr today · 5 by 30 yrs out
Nearby sold comps map
Loading sold comps map…
Walkable amenities ~0.75 mi
Loading nearby amenities…
Taxation est. · year 1
- Rental income
- $23,470
- − Mortgage interest
- −$7,632
- − Property taxes
- −$4,944
- − Insurance
- −$5,800
- − Repairs & maintenance
- −$1,878
- − Management
- −$1,878
- − Depreciation
- −$3,964
- Taxable loss
- −$2,625
- Est. tax savings @ 24.0%
- +$630
- After-tax cash flow
- $-147/yr
For passive investors: Depreciation is non-cash, so a rental often shows a tax loss while cash-flowing — sheltering income. Rental losses are passive: they offset passive income freely, and up to $25,000/yr can offset ordinary (W-2) income if you actively participate and your MAGI is under $100k (phasing out to $0 by $150k); unused losses carry forward. On sale, claimed depreciation is recaptured at up to 25%, and gains may owe capital-gains tax (a 1031 exchange can defer both). Figures are a year-1 estimate at your 24.0% rate — not tax advice; consult a CPA.
Schools (NCES district)
- District
- Pennsville Public School District
- NCES district ID
- 3409120
- Math proficiency
- 12% ▼ -26.00%
- Reading proficiency
- 45% ▬ 0.00%
- Median HH income
- $58,237
- Composite
- 25.61/100
- National rank
- #7411
- State rank
- #356 of 472 in NJ
Livability — Pennsville
- Score
- 72/100
- State rank
- #225
- US rank
- #6134
Category grades
Schools grade is shown separately in the Schools card above.
Census & demographics
- Census place
- Pennsville, NJ
- City population
- 12,766
- Population (ZIP)
- 12,477
Population outlook (Salem County) Hauer SSP2
- Today (2025)
- 59,905 people
- By 2030
- 57,351 · -4.3%
- By 2040
- 51,837 · -13.5%
- By 2050
- 46,356 · -22.6%
- By 2075
- 36,452 · -39.2%
- By 2100
- 28,907 · -51.7%
Race, ethnicity, and origin ACS 2023
- Neighborhood character
- Predominantly White (84%)
- Race & ethnicity
- White 84% Hispanic / Latino 7% Two or more races 5% Black 4%
- Hispanic origin (detail)
- Mexican 1% Puerto Rican 4%
- Common ancestry
- Romanian 6% Slovak 2% Lithuanian 1%
- Foreign-born
- 3% · Canada
- Languages at home
- 93% English-only · Other Indo-European 4% Spanish 2%
Political lean MEDSL · Salem
- 2024 margin
- R (+19.2) · D 39.6% · R 58.8% · Other 1.6%
- 2008→2024 swing
- -23.1pp toward R · 2008: 3.9pp · 2024: -19.2pp
- All cycles
- 2024: R+19.2 2020: R+12.8 2016: R+15.4 2012: D+0.8 2008: D+3.9
Not yet ingested
- Civics
- —
Market trends
- HPI YoY
- ▼ -85.34%
- Current HPI
- 275.2185
- Rent YoY
- —
- Metro
- —
- State GDP YoY
- ▲ 2.05%
- F500 in state
- 34
Industry mix (Fortune 500 HQ in NJ)
| Industry | F500 HQs | Revenue |
|---|---|---|
| Consumer Goods | 3 | $31B |
|
||
| Pharmaceuticals | 2 | $153B |
|
||
| Technology | 2 | $21B |
|
||
| Insurance | 2 | $20B |
|
||
| Healthcare | 2 | $19B |
|
||
| Financial Services | 1 | $70B |
|
||
Price history
+147.7% since first listed21 events — show timeline
- 2026-05-21 Pending — GSMLS
- 2026-05-20 Pending — BRIGHT MLS
- 2026-04-20 Listed $136,250 BRIGHT MLS
- 2026-04-20 Listed $136,250 GSMLS
- 2024-08-23 Sold (Public Records) $195,000 Public Records
- 2024-04-20 Listing Removed — BRIGHT MLS
- 2024-04-08 Price Changed $159,000 BRIGHT MLS
- 2024-03-25 Listed $165,000 BRIGHT MLS
- 2018-04-30 Sold (MLS) $33,325 BRIGHT MLS
- 2018-04-30 Sold (MLS) $33,325 TREND
- 2018-04-28 Pending — BRIGHT MLS
- 2018-04-28 Pending — TREND
- 2018-01-07 Price Changed $40,000 TREND
- 2017-11-12 Relisted — TREND
- 2017-11-07 Delisted — TREND
- 2017-08-30 Price Changed $50,000 TREND
- 2017-07-10 Price Changed $55,000 TREND
- 2017-06-07 Listed $75,000 TREND
- 2017-06-04 Listed $40,000 BRIGHT MLS
- 1993-06-24 Sold (Public Records) $67,000 Public Records
- 1990-10-26 Sold (Public Records) $55,000 Public Records
Property tax history
+3.9%/yrLatest (2025): $4,944 · +2.0% YoY. Source: county tax records.
Cash-flow waterfall
monthlySold comps — $/sqft
last 12 mo · ≤1 miLoading sold comps…