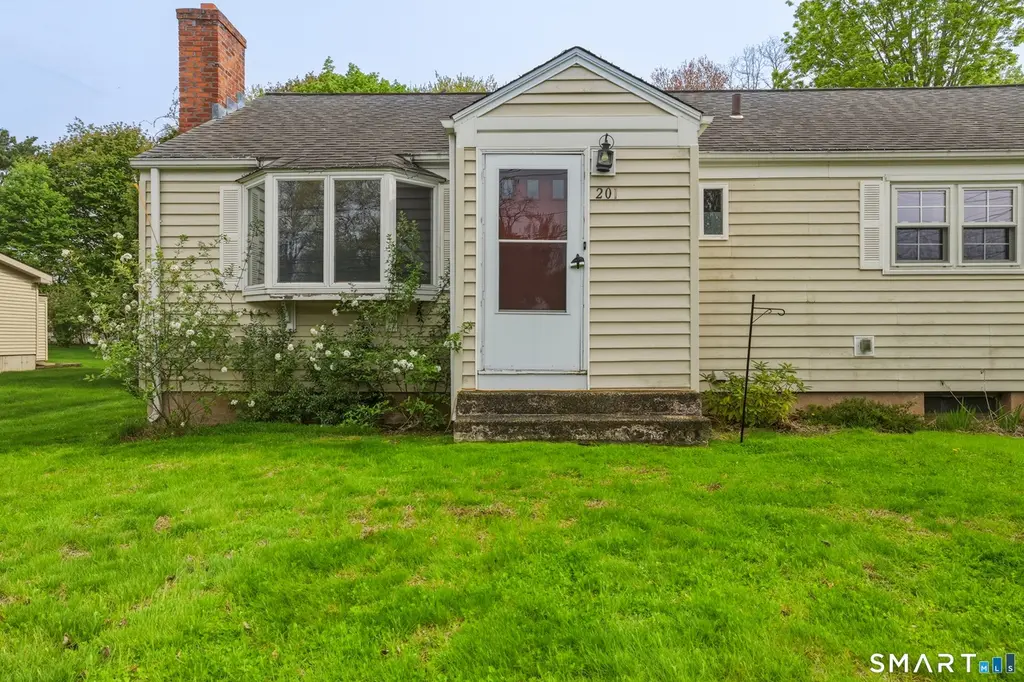
201 Cherry Hill Dr
Newington, CT 06111
$319,000C-
3 bd · 1.0 ba ·
1,324 sqft ·
Built 1952
· SingleFamily
· Under Contract
· 15 DOM
Cashflow @ list (25.0% down · 7.5%)
Estimated rent
$2,939/mo
Mortgage (P&I)
−$1,673
Tax + insurance
−$592
HOA
−$0
Vac / Maint / Mgmt
−$617
Net cashflow
$57/mo
Annual
$685/yr
Cap rate
6.51%
Cash-on-cash
0.77%
DSCR
1.03
1% rule
0.92%
Cash to close
$89,320
Investor read
- This is a 3-bed/1.0-bath single-family listed at $319k.
- At list price, monthly cash flow is $57 ($685/yr) — positive.
- The deal already cash-flows at list — no discount required.
- To meet the 1% rule (rent ≥ 1% of price), the offer needs to be $294k (7.9% below list).
- It's been on market 15 days — a 2% lower offer ($314k) is reasonable based on typical stale-listing flexibility.
- Recommended offer: $294k (7.9% below list) — sets the bar for 1% rule.
- Local home prices are declining (-3.0%/yr); year-one equity from $2k of loan paydown is wiped out by about $10k of value loss. Plan a longer hold.
- Location reads 79/100 on livability (#30 in CT, #2,143 nationally) — a middle-class / working-renter tenant base. Strengths: employment A+, housing A+, health & safety A+; Watch: amenities F, commute F.
- Newington School District (suburban): math 38% / reading 53% proficiency, ranked #87 of 153 in CT (top 57%) — families likely to look elsewhere, expect single-tenant / working-renter base with shorter leases; only 15% free/reduced lunch — higher-income household profile.
- Zoned schools: Newington High School (math 52% / reading 70%, grade C+, #43 of 194 statewide, top 22%, 1,327 students, 32% FRL) — zoned schools average 32% FRL vs 15% district-wide (16 pts higher); higher-poverty schools than district average — tighter screening recommended.
- Zoned-school proficiency averages 61% at this address vs 46% district-wide (+16 pts) — the actual schools serving this property are materially stronger than the Newington School District average implies; a family-tenant draw the district grade alone would hide.
- Watch-outs: built in 1952 — expect roof / HVAC / electrical / plumbing capex.
- Market conditions: Rents flat; 94 active listings in the ZIP; 16 comparable units currently listed for rent nearby; rentals at typical pace (median 15d on market — plan ~3-4 weeks tenant-placement turnaround); solid renter incomes; 1,867 units permitted in Capitol Planning Region in 2024 (1,399 in 5+ unit buildings).
- 4 sale attempts since 7y ago with the ask held roughly flat each time — persistent listings suggest the price (not the market) is what's stuck; bring a comps-based counter.
- Cap rate 6.5% vs local median 4.4% in Newington — top-decile yield for the area; either an underpriced asset or a hidden risk that comps aren't pricing in. Stress-test before assuming the spread holds.
- This rent runs 34% of the median local income ($103k/yr) — at the standard rent-burdened threshold; future hikes will face affordability resistance.
Questions for listing agent
- Built in 1952 — when were the roof, HVAC, electrical panel, plumbing, and water heater last replaced?
- Is there a deadline driving the sale (1031 exchange, divorce, estate, relocation)? That informs how much negotiation room exists.
- What's the average days-on-market for RENTAL listings here right now (not sales)? A rising rental-DOM trend means longer vacancies and softer asking-rent achievability than the comps imply.
- What's the recent tenant-quality profile in this submarket — average credit score on applications, eviction rate, late-payment / NSF rate, and stable-employment percentage? A property-management company in the area should have these aggregated.
- How much new for-sale + rental construction is in the pipeline within 1–3 miles? Heavy new supply typically softens prices + rents 12–24 months out; constrained supply supports both.
CashFlowRE · CFR-WJCTTC3VQWJAXA
· Data 3 weeks ago
cashflowre.app · 2026-05-29