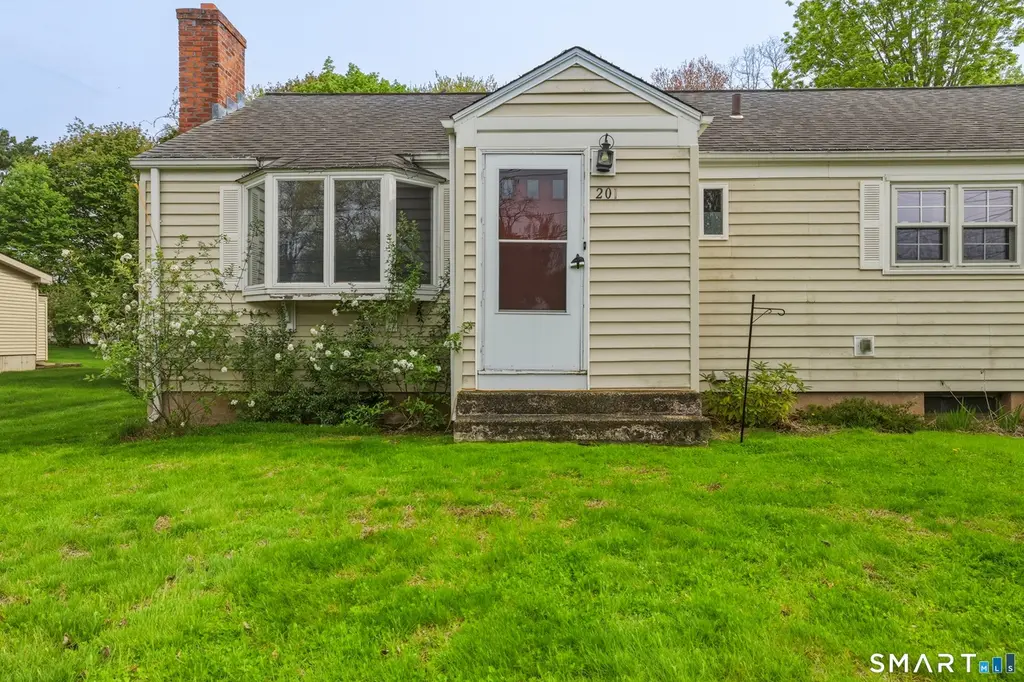
201 Cherry Hill Dr · Newington, CT
Flood risk No data
- FEMA flood zone
- —
- Chance of flooding over 30 yrs
- —
- Est. flood insurance / yr
- —
Fire risk No data
- Est. fire insurance / yr
- —
Heat risk No data
- Hot days now (above threshold)
- —
- Hot days in 30 yrs
- —
Wind risk No data
- Chance of severe wind over 30 yrs
- —
Air-quality risk No data
- Unhealthy air days now
- —
- Unhealthy air days in 30 yrs
- —
Risk factors via First Street. Map © Google.
Why this score? — see what drove the C- grade
The composite is a weighted blend of 9 inputs, each scored 0–100. Each bar is that input's sub-score; the figure is the points it added to the 100-point composite (weight × sub-score).
- ARV discount +15.0/15.0
- Cash flow +14.3/30.0
- DSCR +4.3/10.0
- 1% rule +4.2/10.0
- Schools +4.1/10.0
- Livability +4.0/5.0
- Rent growth +2.7/5.0
- Condition / age +2.5/5.0
- Appreciation +0.0/10.0
$319,000
🖨 Deal sheet 📄 Offer letter ✓ Due diligence
Listing remarks MLS
Check out this charming ranch! This property is ready for a new owner! The home features hardwood floors, 3 bedrooms, 1 bath, fireplace, dinning area, deck, spacious flat yard, detached garage and so much more! Perfect starter home or one floor living in a desired neighborhood, centrally located! Come view it and make it yours!
Key facts
- 0.26 acre lot
- Garage
- Built 1952
Property features AI
Exterior
- Parking: Detached garage (1 car)
- Utilities: Public water connected; Public sewer connected
- Home design: Single-family home
- Construction: Built with frame construction; Concrete foundation; Asphalt shingle roof; Vinyl siding
- Exterior features: Deck; Lightly wooded, level lot
Interior
- Kitchen: Gas range; Oven/Range; Microwave; Refrigerator
- Bedrooms: 3 bedrooms
- Bathrooms: 1 full bathroom
- Heating & cooling: Hot water heating; Natural gas fuel; Central air
- Interior features: 5 total rooms; Full basement with hatchway access; Attic accessible via hatch; One fireplace; Central air conditioning
- Laundry & utility: Washer; Electric dryer; Laundry room on lower level; Tankless hot water
Neighborhood map
What this means for you Summary
Snapshot
- This is a 3-bed/1.0-bath single-family listed at $319k.
Deal economics
- At list price, monthly cash flow is $57 ($685/yr) — positive.
- The deal already cash-flows at list — no discount required.
- To meet the 1% rule (rent ≥ 1% of price), the offer needs to be $294k (7.9% below list).
- Recommended offer: $294k (7.9% below list) — sets the bar for 1% rule.
- Cap rate 6.5% vs local median 4.4% in Newington — top-decile yield for the area; either an underpriced asset or a hidden risk that comps aren't pricing in. Stress-test before assuming the spread holds.
Location & tenants
- Location reads 79/100 on livability (#30 in CT, #2,143 nationally) — a middle-class / working-renter tenant base. Strengths: employment A+, housing A+, health & safety A+; Watch: amenities F, commute F.
- Newington School District (suburban): math 38% / reading 53% proficiency, ranked #87 of 153 in CT (top 57%) — families likely to look elsewhere, expect single-tenant / working-renter base with shorter leases; only 15% free/reduced lunch — higher-income household profile.
- Zoned schools: Newington High School (math 52% / reading 70%, grade C+, #43 of 194 statewide, top 22%, 1,327 students, 32% FRL) — zoned schools average 32% FRL vs 15% district-wide (16 pts higher); higher-poverty schools than district average — tighter screening recommended.
- Zoned-school proficiency averages 61% at this address vs 46% district-wide (+16 pts) — the actual schools serving this property are materially stronger than the Newington School District average implies; a family-tenant draw the district grade alone would hide.
- Market conditions: Rents flat; 94 active listings in the ZIP; 16 comparable units currently listed for rent nearby; rentals at typical pace (median 14d on market — plan ~3-4 weeks tenant-placement turnaround); solid renter incomes; 1,867 units permitted in Capitol Planning Region in 2024 (1,399 in 5+ unit buildings).
- This rent runs 34% of the median local income ($103k/yr) — at the standard rent-burdened threshold; future hikes will face affordability resistance.
Forward outlook
- Local home prices are declining (-3.0%/yr); year-one equity from $2k of loan paydown is wiped out by about $10k of value loss. Plan a longer hold.
Negotiation context
- It's been on market 15 days — a 2% lower offer ($314k) is reasonable based on typical stale-listing flexibility.
- 4 sale attempts since 7y ago with the ask held roughly flat each time — persistent listings suggest the price (not the market) is what's stuck; bring a comps-based counter.
Risks & watch-outs
- Watch-outs: built in 1952 — expect roof / HVAC / electrical / plumbing capex.
Questions for the listing agent
- Built in 1952 — when were the roof, HVAC, electrical panel, plumbing, and water heater last replaced?
- Is there a deadline driving the sale (1031 exchange, divorce, estate, relocation)? That informs how much negotiation room exists.
- What's the average days-on-market for RENTAL listings here right now (not sales)? A rising rental-DOM trend means longer vacancies and softer asking-rent achievability than the comps imply.
- What's the recent tenant-quality profile in this submarket — average credit score on applications, eviction rate, late-payment / NSF rate, and stable-employment percentage? A property-management company in the area should have these aggregated.
- How much new for-sale + rental construction is in the pipeline within 1–3 miles? Heavy new supply typically softens prices + rents 12–24 months out; constrained supply supports both.
Investment metrics
- 1% rule
- 0.92% ✗
- Cap rate
- 6.51%
- Cash-on-cash
- 0.77%
- DSCR
- 1.03
- GRM
- 9.0
CMA / ARV
- ARV (median comp)
- $399,015
- List price
- $319,000
- Delta
- -20.05%
- Verdict
- UNDERPRICED
- Comps
- 20 within 1.0 mi
Show comp detail 12 sales within ~0.75 mi
| Address | Dist | Beds/Ba | Sqft | Sold | Price | $/sf | Match |
|---|---|---|---|---|---|---|---|
| 201 Cherry Hill Dr | 0.00mi | 3/1.0 | 1,324 (0%) | 0mo | $344,000 | $260 | 100 |
| 40 Quincy Ln | 0.10mi | 2/1.5 (-1) | 1,320 (-0%) | 3mo | $315,000 | $239 | 85 |
| 54 Red Top Dr | 0.22mi | 3/1.5 | 1,282 (-3%) | 6mo | $410,000 | $320 | 77 |
| 16 Thornton Dr | 0.21mi | 3/1.0 | 1,475 (+11%) | 5mo | $299,900 | $203 | 67 |
| 25 Fowler Dr | 0.36mi | 4/2.0 (+1) | 1,382 (+4%) | 3mo | $435,000 | $315 | 64 |
| 99 Knollwood Rd | 0.52mi | 3/1.5 | 1,284 (-3%) | 10mo | $480,000 | $374 | 60 |
| 21 Chestnut Rd | 0.36mi | 3/2.0 | 1,448 (+9%) | 4mo | $425,000 | $294 | 60 |
| 53 Groveland Ter | 0.38mi | 2/2.0 (-1) | 1,366 (+3%) | 9mo | $290,000 | $212 | 60 |
| 30 Jeffrey Ln | 0.40mi | 3/2.5 | 1,242 (-6%) | 10mo | $400,000 | $322 | 57 |
| 575 S Main St | 0.53mi | 3/2.0 | 1,452 (+10%) | 3mo | $422,700 | $291 | 53 |
| 293 Elmfield St | 0.53mi | 3/2.5 | 1,215 (-8%) | 8mo | $420,000 | $346 | 49 |
| 521 S Main St | 0.70mi | 4/2.0 (+1) | 1,450 (+10%) | 8mo | $390,000 | $269 | 36 |
Match score weights: distance 35% · size 25% · config 20% · recency 20%. Top-matched comps best support the ARV.
Projected returns pro-forma
-3.0% appreciation · 0.98% rent growth · sell at horizon
- IRR
- -17.4%
- Equity multiple
- 0.40×
- Total profit
- $-53,830
- Equity at exit
- $47,564
- IRR
- -13.8%
- Equity multiple
- 0.27×
- Total profit
- $-64,937
- Equity at exit
- $27,581
Cash invested: $89,320 (down + closing). Projections, not guarantees.
Landlord ↔ Tenant lean methodology
- Overall (STATE)
- 27 Tenant-Leaning
- State Connecticut
- 27 Tenant-Leaning · D+7
- County
- — inherits STATE
- City
- — inherits STATE
ZIP-level market 06111
- Rents YoY
- 1.0%
- Active inventory
- 94
- Price-to-rent
- 9.0×
Monthly cashflow live
- Estimated rent
- $2,939 high interval (Pro) →
- Mortgage (P&I)
- −$1,673
- Tax from tax record
- −$459 /mo · $5,511/yr
- Insurance
- −$133
- HOA
- −$0
- Vacancy / Maint / Mgmt
- −$617
- Net cashflow
- $57
Break-even live
UW: 25.0% down · 7.5% · 30yr · 1.5% tax · 5.0% vac · 8.0% maint · 8.0% mgmt
Financing live
Cash to close
- Down payment
- $79,750
- Closing costs
- $9,570
- Reserves months
- —
- Total cash needed
- —
Loan-product check · same deal, 3 products live
Conventional
25% down · 7.5% · 30yr
- Down + closing
- —
- Monthly P&I
- —
- Monthly cashflow
- —
- DSCR
- —
- Eligible?
- —
Personal DTI + credit; lowest rate.
DSCR
20% down · 8.5% · 30yr
- Down + closing
- —
- Monthly P&I
- —
- Monthly cashflow
- —
- DSCR
- —
- Eligible?
- —
No personal income docs; deal must DSCR.
Hard money
10% down · 12.0% · 12mo
- Down + closing
- —
- Monthly P&I
- —
- Monthly cashflow
- —
- DSCR
- —
- Eligible?
- —
Short-term bridge; refi at stabilization.
Rent comps 16 comps
| Address | Beds | Baths | Sqft | Rent | $/sqft | DOM | Units | Dist |
|---|---|---|---|---|---|---|---|---|
| 1600 New Britain Ave Farmington, CT | 1.0–2.0 | 1.0–1.5 | 1112 | $2,595 | $2.33 | 1d | 1 | 0.53mi |
| 132 Federal St West Hartford, CT | 4.0 | 2.0 | 1296 | $3,000 | $2.31 | 23d | 1 | 0.66mi |
| 10 Berkshire Rd West Hartford, CT | 1.0–2.0 | 1.5–2.0 | 963 | $2,850 | $2.96 | 1d | 1 | 0.80mi |
| 11 King Arthur Way Unit 9-5 Newington, CT | 2.0 | 1.5 | 950 | $2,150 | $2.26 | 3d | 1 | 0.80mi |
| 11 King Arthur Way Apt 12 Newington, CT | 2.0 | 1.5 | 950 | $2,200 | $2.32 | 43d | 1 | 0.80mi |
| 25 Madsen Rd West Hartford, CT | 4.0 | 2.0 | 1488 | $3,500 | $2.35 | 1d | 1 | 0.81mi |
| 46 Brittany Farms Rd New Britain, CT | 1.0–2.0 | 1.0 | 820 | $2,025 | $2.47 | 1d | 1 | 1.14mi |
| 154 Harding Ave Newington, CT | 3.0 | 2.0 | 1747 | $3,000 | $1.72 | 23d | 1 | 1.17mi |
| 83 Main St Newington, CT | 1.0–2.0 | 1.0 | 825 | $2,195 | $2.66 | 1d | 1 | 1.23mi |
| 38 Bradford Walk Unit 38 Farmington, CT | 2.0 | 2.5 | 1830 | $3,500 | $1.91 | 10d | 1 | 1.26mi |
| 28 Ashford Rd West Hartford, CT | 4.0 | 2.5 | 1779 | $3,950 | $2.22 | 19d | 1 | 1.27mi |
| 143 Brittany Farms Rd Unit A New Britain, CT | 3.0 | 2.5 | 1722 | $2,750 | $1.60 | 14d | 1 | 1.29mi |
| 11 Kimberly Rd West Hartford, CT | 3.0 | 1.5 | 1276 | $3,200 | $2.51 | 23d | 1 | 1.29mi |
| 124 Mayflower St West Hartford, CT | 3.0 | 1.0 | 1025 | $2,650 | $2.59 | 23d | 1 | 1.38mi |
| 30 Schoolhouse Dr #105 West Hartford, CT | 2.0 | 2.0 | 1404 | $2,950 | $2.10 | 11d | 1 | 1.49mi |
| 10 Greenacres Ave West Hartford, CT | 3.0 | 1.5 | 1302 | $3,400 | $2.61 | 21d | 1 | 1.50mi |
Listing history 17 events
-
2026-05-16status Under Contract 385-char remark
-
2026-05-05historical Under Contract - Continue to Show 385-char remark
-
2026-05-02$319,000 Active 385-char remark
-
2026-04-30historical $319,000 385-char remark
-
2021-01-11soldstatus $225,000 Closed 329-char remark
Show marketing remark (329 chars)
Check out this charming ranch! This property is ready for a new owner! The home features hardwood floors, 3 bedrooms, 1 bath, fireplace, dinning area, deck, spacious flat yard, detached garage and so much more! Perfect starter home or one floor living in a desired neighborhood, centrally located! Come view it and make it yours!
-
2020-10-14historical Under Contract - Continue to Show 329-char remark
Show marketing remark (329 chars)
Check out this charming ranch! This property is ready for a new owner! The home features hardwood floors, 3 bedrooms, 1 bath, fireplace, dinning area, deck, spacious flat yard, detached garage and so much more! Perfect starter home or one floor living in a desired neighborhood, centrally located! Come view it and make it yours!
-
2020-10-04$219,900 Active 329-char remark
Show marketing remark (329 chars)
Check out this charming ranch! This property is ready for a new owner! The home features hardwood floors, 3 bedrooms, 1 bath, fireplace, dinning area, deck, spacious flat yard, detached garage and so much more! Perfect starter home or one floor living in a desired neighborhood, centrally located! Come view it and make it yours!
-
2019-12-19historical
-
2019-11-01price $214,900
-
2019-10-16price $219,900
-
2019-09-29price $224,900
-
2019-09-13price $229,900
-
2019-09-13status Active
-
2019-08-22historical
-
2019-07-29$214,900 Active
-
2014-07-11soldstatus $200,000
-
1995-12-22soldstatus $120,000
ⓘ Source: listings_history table (triggers on properties + properties_extension) + one-shot
backfill from property_details.listing_events for pre-trigger history.
Tax reassessment forecast CT · Partial reset (capped growth)
- Current annual tax
- $5,511 · $459/mo
- Projected year-2 tax
- $6,169 · $514/mo
- Expected delta
- +$658/yr (+$55/mo · 11.9%)
ⓘ Screening estimate from a state-policy table — verify with the county assessor before closing.
Nearby sold comps map
Loading sold comps map…
Walkable amenities ~0.75 mi
Loading nearby amenities…
Taxation est. · year 1
- Rental income
- $35,273
- − Mortgage interest
- −$17,869
- − Property taxes
- −$5,511
- − Insurance
- −$1,595
- − Repairs & maintenance
- −$2,822
- − Management
- −$2,822
- − Depreciation
- −$9,280
- Taxable loss
- −$4,626
- Est. tax savings @ 24.0%
- +$1,110
- After-tax cash flow
- $1,795/yr
For passive investors: Depreciation is non-cash, so a rental often shows a tax loss while cash-flowing — sheltering income. Rental losses are passive: they offset passive income freely, and up to $25,000/yr can offset ordinary (W-2) income if you actively participate and your MAGI is under $100k (phasing out to $0 by $150k); unused losses carry forward. On sale, claimed depreciation is recaptured at up to 25%, and gains may owe capital-gains tax (a 1031 exchange can defer both). Figures are a year-1 estimate at your 24.0% rate — not tax advice; consult a CPA.
Schools (NCES district)
- District
- Newington School District
- NCES district ID
- 0902880
- Math proficiency
- 38% ▼ -14.00%
- Reading proficiency
- 53% ▼ -6.00%
- Median HH income
- $74,751
- Composite
- 41.37/100
- National rank
- #3489
- State rank
- #87 of 153 in CT
Livability — Newington
- Score
- 79/100
- State rank
- #30
- US rank
- #2143
Category grades
Schools grade is shown separately in the Schools card above.
Census & demographics
- Census place
- Newington, CT
- County
- Hartford County · 754,208 people
- City population
- 30,896
- Metro
- Hartford-East Hartford-Middletown, CT
- Population (ZIP)
- 30,896
- Household income
- $102,884
- Rent vs Own
- Severe rent burden
- 553.0
Population outlook (Capitol County) Hauer SSP2
- By 2040
- 1,063,519
Race, ethnicity, and origin ACS 2023
- Neighborhood character
- Predominantly White (72%)
- Race & ethnicity
- White 72% Hispanic / Latino 12% Two or more races 8% Asian 7% Black 4%
- Hispanic origin (detail)
- Mexican 1% Puerto Rican 5%
- Common ancestry
- Romanian 12% Lithuanian 7% Russian 3%
- Foreign-born
- 20% · Canada, Jamaica, China
- Languages at home
- 72% English-only · Spanish 8% Other Indo-European 8% Russian/Polish/Slavic 7%
Political lean MEDSL · Capitol
- 2024 margin
- Strong D (+21.9) · D 60.1% · R 38.2% · Other 1.7%
- All cycles
- 2024: D+21.9
Not yet ingested
- Civics
- —
Market trends
- HPI YoY
- ▼ -194.94%
- Current HPI
- 185.3332
- Rent YoY
- ▲ 0.98%
- Metro
- Hartford-East Hartford-Middletown, CT
- State GDP YoY
- ▲ 1.06%
- F500 in state
- 38
Industry mix (Fortune 500 HQ in CT)
| Industry | F500 HQs | Revenue |
|---|---|---|
| Industrial Machinery | 4 | $38B |
|
||
| Insurance | 3 | $71B |
|
||
| Financial Services | 2 | $25B |
|
||
| Transportation / Logistics | 2 | $18B |
|
||
| Healthcare | 1 | $247B |
|
||
| Telecommunications | 1 | $55B |
|
||
Price history
+186.7% since first listed18 events — show timeline
- 2026-06-05 Sold (MLS) $344,000 Smart MLS
- 2026-05-16 Pending — Smart MLS
- 2026-05-05 Contingent — Smart MLS
- 2026-05-02 Listed $319,000 Smart MLS
- 2026-04-30 Coming Soon $319,000 Smart MLS
- 2021-01-11 Sold (MLS) $225,000 Smart MLS
- 2020-10-14 Contingent — Smart MLS
- 2020-10-04 Listed $219,900 Smart MLS
- 2019-12-19 Listing Removed — Smart MLS
- 2019-11-01 Price Changed $214,900 Smart MLS
- 2019-10-16 Price Changed $219,900 Smart MLS
- 2019-09-29 Price Changed $224,900 Smart MLS
- 2019-09-13 Price Changed $229,900 Smart MLS
- 2019-09-13 Relisted — Smart MLS
- 2019-08-22 Listing Removed — Smart MLS
- 2019-07-29 Listed $214,900 Smart MLS
- 2014-07-11 Sold (Public Records) $200,000 Public Records
- 1995-12-22 Sold (Public Records) $120,000 Public Records
Property tax history
+2.0%/yrLatest (2025): $5,511 · +0.8% YoY. Source: county tax records.
Cash-flow waterfall
monthlySold comps — $/sqft
last 12 mo · ≤1 miLoading sold comps…