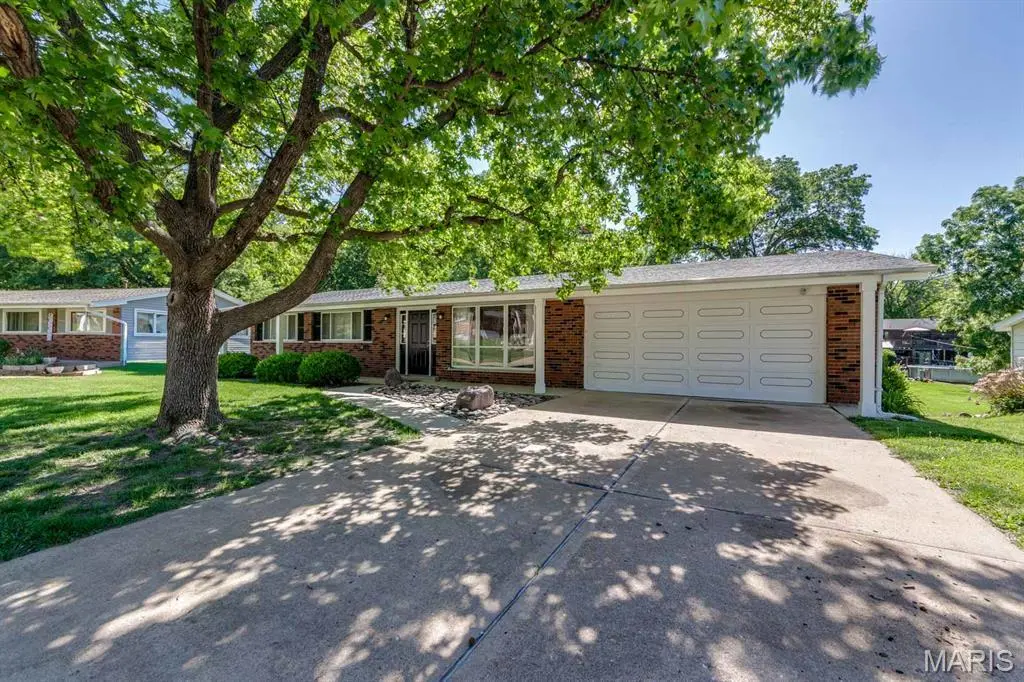
20 Elderwood Ct
Fenton, MO 63026
$358,000F
3 bd · 3.0 ba ·
1,118 sqft ·
Built 1965
· SingleFamily
· Pending
· 25 DOM
Cashflow @ list (25.0% down · 7.5%)
Estimated rent
$1,557/mo
Mortgage (P&I)
−$1,877
Tax + insurance
−$404
HOA
−$0
Vac / Maint / Mgmt
−$327
Net cashflow
$-1,051/mo
Annual
$-12,614/yr
Cap rate
2.77%
Cash-on-cash
-12.58%
DSCR
0.44
1% rule
0.43%
Cash to close
$100,240
Investor read
- This is a 3-bed/3.0-bath single-family listed at $358k.
- At list price, monthly cash flow is $-1k ($-13k/yr) — negative.
- To cash-flow at today's rent, offer at most $172k (51.9% below list).
- To meet the 1% rule (rent ≥ 1% of price), the offer needs to be $156k (56.5% below list).
- It's been on market 25 days — a 2% lower offer ($353k) is reasonable based on typical stale-listing flexibility.
- Recommended offer: $156k (56.5% below list) — sets the bar for 1% rule.
- Local home prices are declining (-3.0%/yr); year-one equity from $2k of loan paydown is wiped out by about $11k of value loss. Plan a longer hold.
- Location reads 74/100 on livability (#65 in MO, #4,484 nationally) — a middle-class / working-renter tenant base. Strengths: crime A+, employment A+, housing A+; Watch: amenities F, commute F, health & safety F.
- Lindbergh Schools (suburban): math 41% / reading 55% proficiency, ranked #38 of 324 in MO (top 12%) — families likely to look elsewhere, expect single-tenant / working-renter base with shorter leases; only 13% free/reduced lunch — higher-income household profile.
- Zoned schools: Concord Elem. School (math 43% / reading 62%, grade C-, #226 of 1,115 statewide, top 21%, 552 students, 10% FRL); Lindbergh Sr. High (math 56% / reading 70%, grade B-, #26 of 521 statewide, top 5%, 2,235 students, 12% FRL) — zoned schools at 11% FRL track the district average.
- Market conditions: Rents rising fast (+7.7%/yr); 146 active listings in the ZIP; 2 comparable units currently listed for rent nearby; solid renter incomes; 920 units permitted in St. Louis County in 2024 (250 in 5+ unit buildings).
- 3 sale attempts since 12y ago with the ask held roughly flat each time — persistent listings suggest the price (not the market) is what's stuck; bring a comps-based counter.
- Current owner paid $214k; list at $358k implies a 68% gain — meaningful room to come down on a strong offer.
- Climate carrying-cost: major flood risk; extreme-heat days projected 7→21/yr by 2055 (HVAC capex compounding) — expect insurance premiums to compound above CPI over the hold.
Questions for listing agent
- What do current leases actually rent for vs. the listed asking? Can we see a recent rent roll and the last 12 months of T-12 income?
- Built in 1965 — when were the roof, HVAC, electrical panel, plumbing, and water heater last replaced?
- Is there a deadline driving the sale (1031 exchange, divorce, estate, relocation)? That informs how much negotiation room exists.
- Schools are B-rated — typically a magnet for longer-tenancy family renters. What's the average tenant stay here, and is there a school-zone premium baked into asking?
- The area grade is low — what's the realistic commute time and amenity access for the typical tenant pool here? Any planned neighborhood developments (good or bad) we should know about?
- What's the average days-on-market for RENTAL listings here right now (not sales)? A rising rental-DOM trend means longer vacancies and softer asking-rent achievability than the comps imply.
- What's the recent tenant-quality profile in this submarket — average credit score on applications, eviction rate, late-payment / NSF rate, and stable-employment percentage? A property-management company in the area should have these aggregated.
- How much new for-sale + rental construction is in the pipeline within 1–3 miles? Heavy new supply typically softens prices + rents 12–24 months out; constrained supply supports both.
CashFlowRE · CFR-WJK3647NFDMS4C
· Data 1 week ago
cashflowre.app · 2026-05-29