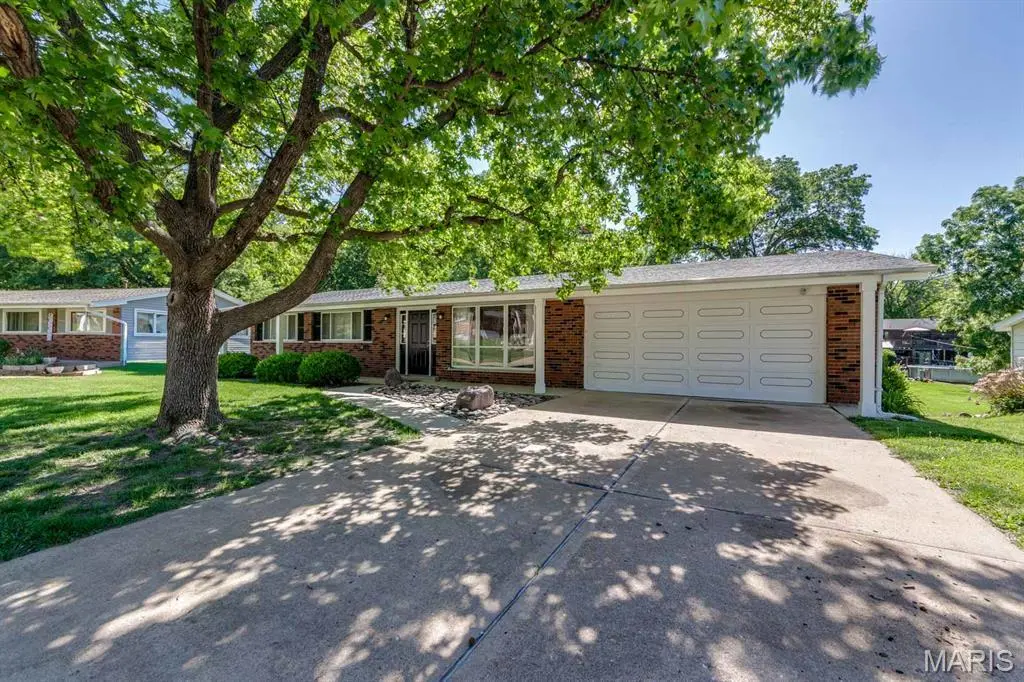
20 Elderwood Ct · Fenton, MO
Flood risk 6/10 · Moderate
- FEMA flood zone
- X (unshaded)
- Chance of flooding over 30 yrs
- 0.72%
- Est. flood insurance / yr
- $473 – $860
Fire risk 3/10 · Minor
- Est. fire insurance / yr
- $1,054 – $1,958
Heat risk 5/10 · Moderate
- Hot days now (above 107°F)
- 7 days/yr
- Hot days in 30 yrs
- 21 days/yr
Wind risk 2/10 · Minimal
- Chance of severe wind over 30 yrs
- 1.0%
Air-quality risk 2/10 · Minimal
- Unhealthy air days now
- 1 days/yr
- Unhealthy air days in 30 yrs
- 2 days/yr
Risk factors via First Street. Map © Google.
Why this score? — see what drove the F grade
The composite is a weighted blend of 9 inputs, each scored 0–100. Each bar is that input's sub-score; the figure is the points it added to the 100-point composite (weight × sub-score).
- ARV discount +4.9/15.0
- Rent growth +4.4/5.0
- Schools +4.3/10.0
- Cash flow +3.7/30.0
- Livability +3.7/5.0
- Condition / age +2.5/5.0
- 1% rule +0.0/10.0
- DSCR +0.0/10.0
- Appreciation +0.0/10.0
$358,000
🖨 Deal sheet 📄 Offer letter ✓ Due diligence
Listing remarks MLS
Well maintained 3 bedroom 3 bath ranch located in the Lindbergh School District and municipality of Fenton. Has a sought after open floor plan with gorgeous hardwood floors, the full masonry fireplace in the living room creates a cozy and warm atmosphere. Stylish kitchen just off the dining room. From the dining room you can walk out to a spectacular covered deck that overlooks the large backyard. Great area for barbecues and entertaining. The spacious finished lower level offers a family/rec room area and bar. Has a full bath just off the walkout basement door. Would be a wonderful yard for an in-ground pool. Short drive to Gravois Bluffs shopping district. Enjoy the amenities of living in Fenton!!
Key facts
- 0.31 acre lot
- 2 garage spots
- Built 1965
Property features AI
Finance
- Other: Living area reported as 1,818 total (about 1,118 above grade and 700 below grade)
- Financial info: Lease not considered
Exterior
- Parking: Attached 2-car garage
- Utilities: Public water; Public sewer; Electric service by Ameren
- Home design: Single-family residence; One level
- Construction: Brick veneer, stone veneer and vinyl siding exterior
- Exterior features: Located on a level cul-de-sac lot; Lot dimensions approximately 147 x 72 x 158 x 107
Interior
- Kitchen: Kitchen on main level
- Bedrooms: Three bedrooms all on the main level
- Bathrooms: Three full bathrooms (two on the main level, one in the lower level)
- Heating & cooling: Forced air heating (natural gas); Central air conditioning; Ceiling fans
- Interior features: Fireplace (1); Basement with partial finish, concrete floor, sump pump and walk-out access
- Laundry & utility: Utilities connected: electricity and natural gas
Neighborhood map
What this means for you Summary
Snapshot
- This is a 3-bed/3.0-bath single-family listed at $358k.
Deal economics
- At list price, monthly cash flow is $-1k ($-13k/yr) — negative.
- To cash-flow at today's rent, offer at most $172k (51.9% below list).
- To meet the 1% rule (rent ≥ 1% of price), the offer needs to be $156k (56.5% below list).
- Recommended offer: $156k (56.5% below list) — sets the bar for 1% rule.
Location & tenants
- Location reads 74/100 on livability (#65 in MO, #4,484 nationally) — a middle-class / working-renter tenant base. Strengths: crime A+, employment A+, housing A+; Watch: amenities F, commute F, health & safety F.
- Lindbergh Schools (suburban): math 41% / reading 55% proficiency, ranked #38 of 324 in MO (top 12%) — families likely to look elsewhere, expect single-tenant / working-renter base with shorter leases; only 13% free/reduced lunch — higher-income household profile.
- Zoned schools: Concord Elem. School (math 43% / reading 62%, grade C-, #226 of 1,115 statewide, top 21%, 552 students, 10% FRL); Lindbergh Sr. High (math 56% / reading 70%, grade B-, #26 of 521 statewide, top 5%, 2,235 students, 12% FRL) — zoned schools at 11% FRL track the district average.
- Market conditions: Rents rising fast (+7.7%/yr); 146 active listings in the ZIP; 2 comparable units currently listed for rent nearby; solid renter incomes; 920 units permitted in St. Louis County in 2024 (250 in 5+ unit buildings).
Forward outlook
- Local home prices are declining (-3.0%/yr); year-one equity from $2k of loan paydown is wiped out by about $11k of value loss. Plan a longer hold.
Negotiation context
- It's been on market 25 days — a 2% lower offer ($353k) is reasonable based on typical stale-listing flexibility.
- 3 sale attempts since 12y ago with the ask held roughly flat each time — persistent listings suggest the price (not the market) is what's stuck; bring a comps-based counter.
- Current owner paid $214k; list at $358k implies a 68% gain — meaningful room to come down on a strong offer.
Risks & watch-outs
- Climate carrying-cost: major flood risk; extreme-heat days projected 7→21/yr by 2055 (HVAC capex compounding) — expect insurance premiums to compound above CPI over the hold.
Questions for the listing agent
- What do current leases actually rent for vs. the listed asking? Can we see a recent rent roll and the last 12 months of T-12 income?
- Built in 1965 — when were the roof, HVAC, electrical panel, plumbing, and water heater last replaced?
- Is there a deadline driving the sale (1031 exchange, divorce, estate, relocation)? That informs how much negotiation room exists.
- Schools are B-rated — typically a magnet for longer-tenancy family renters. What's the average tenant stay here, and is there a school-zone premium baked into asking?
- The area grade is low — what's the realistic commute time and amenity access for the typical tenant pool here? Any planned neighborhood developments (good or bad) we should know about?
- What's the average days-on-market for RENTAL listings here right now (not sales)? A rising rental-DOM trend means longer vacancies and softer asking-rent achievability than the comps imply.
- What's the recent tenant-quality profile in this submarket — average credit score on applications, eviction rate, late-payment / NSF rate, and stable-employment percentage? A property-management company in the area should have these aggregated.
- How much new for-sale + rental construction is in the pipeline within 1–3 miles? Heavy new supply typically softens prices + rents 12–24 months out; constrained supply supports both.
Investment metrics
- 1% rule
- 0.43% ✗
- Cap rate
- 2.77%
- Cash-on-cash
- -12.58%
- DSCR
- 0.44
- GRM
- 19.2
CMA / ARV
- ARV (median comp)
- $338,603
- List price
- $358,000
- Delta
- 5.73%
- Verdict
- FAIR
- Comps
- 20 within 1.0 mi
Show comp detail 3 sales within ~0.75 mi
| Address | Dist | Beds/Ba | Sqft | Sold | Price | $/sf | Match |
|---|---|---|---|---|---|---|---|
| 15 Ashgate Ct | 0.17mi | 4/3.0 (+1) | 1,056 (-6%) | 7mo | $340,000 | $322 | 72 |
| 1242 Larkin Williams Rd | 0.55mi | 2/2.0 (-1) | 1,040 (-7%) | 11mo | $225,000 | $216 | 45 |
| 25 Goode Dr | 0.75mi | 3/1.0 | 1,169 (+5%) | 14mo | $225,000 | $192 | 38 |
Match score weights: distance 35% · size 25% · config 20% · recency 20%. Top-matched comps best support the ARV.
Projected returns pro-forma
-3.0% appreciation · 7.72% rent growth · sell at horizon
- IRR
- -35.4%
- Equity multiple
- -0.17×
- Total profit
- $-117,310
- Equity at exit
- $53,379
- IRR
- -28.4%
- Equity multiple
- -0.53×
- Total profit
- $-153,701
- Equity at exit
- $30,953
Cash invested: $100,240 (down + closing). Projections, not guarantees.
Landlord ↔ Tenant lean methodology
- Overall (STATE)
- 81 Strongly Landlord-Friendly
- State Missouri
- 81 Strongly Landlord-Friendly · R+10
- County
- — inherits STATE
- City
- — inherits STATE
ZIP-level market 63026
- Rents YoY
- 7.7%
- Active inventory
- 146
- Price-to-rent
- 19.2×
Monthly cashflow live
- Estimated rent
- $1,557 medium interval (Pro) →
- Mortgage (P&I)
- −$1,877
- Tax from tax record
- −$255 /mo · $3,054/yr
- Insurance
- −$149
- HOA
- −$0
- Vacancy / Maint / Mgmt
- −$327
- Net cashflow
- $-1,051
Break-even live
UW: 25.0% down · 7.5% · 30yr · 1.5% tax · 5.0% vac · 8.0% maint · 8.0% mgmt
Financing live
Cash to close
- Down payment
- $89,500
- Closing costs
- $10,740
- Reserves months
- —
- Total cash needed
- —
Loan-product check · same deal, 3 products live
Conventional
25% down · 7.5% · 30yr
- Down + closing
- —
- Monthly P&I
- —
- Monthly cashflow
- —
- DSCR
- —
- Eligible?
- —
Personal DTI + credit; lowest rate.
DSCR
20% down · 8.5% · 30yr
- Down + closing
- —
- Monthly P&I
- —
- Monthly cashflow
- —
- DSCR
- —
- Eligible?
- —
No personal income docs; deal must DSCR.
Hard money
10% down · 12.0% · 12mo
- Down + closing
- —
- Monthly P&I
- —
- Monthly cashflow
- —
- DSCR
- —
- Eligible?
- —
Short-term bridge; refi at stabilization.
Rent comps 2 comps
| Address | Beds | Baths | Sqft | Rent | $/sqft | DOM | Units | Dist |
|---|---|---|---|---|---|---|---|---|
| 1054 Green Mountain Ct Fenton, MO | 2.0 | 1.0 | 793 | $1,198 | $1.51 | 2d | 12 | 1.07mi |
| 617 Silver Maple Dr Fenton, MO | 3.0 | 2.0 | 1478 | $900 | $0.61 | 7d | 1 | 1.50mi |
Listing history 17 events
-
2026-06-09status $358,000 Pending 25 DOM
-
2026-06-08days on market $358,000 Active Under Contract 25 DOM
-
2026-06-07days on market $358,000 Active Under Contract 24 DOM
-
2026-06-03days on market $358,000 Active Under Contract 20 DOM
-
2026-06-02days on market $358,000 Active Under Contract 19 DOM
-
2026-06-01days on market $358,000 Active Under Contract 18 DOM
-
2026-05-31days on market $358,000 Active Under Contract 17 DOM
-
2026-05-15$358,000 Active 1295-char remark
-
2026-05-14historical $358,000 1295-char remark
-
2018-05-07soldstatus $213,500
-
2018-05-01soldstatus Closed 708-char remark
Show marketing remark (708 chars)
Well maintained 3 bedroom 3 bath ranch located in the Lindbergh School District and municipality of Fenton. Has a sought after open floor plan with gorgeous hardwood floors, the full masonry fireplace in the living room creates a cozy and warm atmosphere. Stylish kitchen just off the dining room. From the dining room you can walk out to a spectacular covered deck that overlooks the large backyard. Great area for barbecues and entertaining. The spacious finished lower level offers a family/rec room area and bar. Has a full bath just off the walkout basement door. Would be a wonderful yard for an in-ground pool. Short drive to Gravois Bluffs shopping district. Enjoy the amenities of living in Fenton!!
-
2018-03-26status Pending 708-char remark
Show marketing remark (708 chars)
Well maintained 3 bedroom 3 bath ranch located in the Lindbergh School District and municipality of Fenton. Has a sought after open floor plan with gorgeous hardwood floors, the full masonry fireplace in the living room creates a cozy and warm atmosphere. Stylish kitchen just off the dining room. From the dining room you can walk out to a spectacular covered deck that overlooks the large backyard. Great area for barbecues and entertaining. The spacious finished lower level offers a family/rec room area and bar. Has a full bath just off the walkout basement door. Would be a wonderful yard for an in-ground pool. Short drive to Gravois Bluffs shopping district. Enjoy the amenities of living in Fenton!!
-
2018-03-22$199,900 Active 708-char remark
Show marketing remark (708 chars)
Well maintained 3 bedroom 3 bath ranch located in the Lindbergh School District and municipality of Fenton. Has a sought after open floor plan with gorgeous hardwood floors, the full masonry fireplace in the living room creates a cozy and warm atmosphere. Stylish kitchen just off the dining room. From the dining room you can walk out to a spectacular covered deck that overlooks the large backyard. Great area for barbecues and entertaining. The spacious finished lower level offers a family/rec room area and bar. Has a full bath just off the walkout basement door. Would be a wonderful yard for an in-ground pool. Short drive to Gravois Bluffs shopping district. Enjoy the amenities of living in Fenton!!
-
2018-03-20historical $199,900 708-char remark
Show marketing remark (708 chars)
Well maintained 3 bedroom 3 bath ranch located in the Lindbergh School District and municipality of Fenton. Has a sought after open floor plan with gorgeous hardwood floors, the full masonry fireplace in the living room creates a cozy and warm atmosphere. Stylish kitchen just off the dining room. From the dining room you can walk out to a spectacular covered deck that overlooks the large backyard. Great area for barbecues and entertaining. The spacious finished lower level offers a family/rec room area and bar. Has a full bath just off the walkout basement door. Would be a wonderful yard for an in-ground pool. Short drive to Gravois Bluffs shopping district. Enjoy the amenities of living in Fenton!!
-
2014-05-28soldstatus $174,900
-
2014-05-22soldstatus
Show marketing remark (998 chars)
Welcome to a terrific home located in the Lindbergh School District and municipality of Fenton. These long-time owners have done a beautiful job of keeping their home meticulously maintained while updating the kitchen, baths and systems in the past 15 years. The area is quiet and secure with friendly neighbors. Open floor plan will accommodate your guests easily while everyone socializes, nonetheless, they will be drawn to sit on the covered deck and watch the kids play soccer or baseball in the huge level backyard. The huge finished lower level offers another living area and bar with a full bath right off the walkout door, perfect if you plan to build a pool! The neighborhood offers block parties for the entire family and school bus stops at the corner so you can watch your kids load and unload. Gravois Bluffs offers a huge variety of stores; Fenton has many parks & a new SSM St. Clare’s Health Center. (Hardwood floors under carpeting in bedrms, unsure about LR/DR).
-
2014-03-26$174,900
Show marketing remark (998 chars)
Welcome to a terrific home located in the Lindbergh School District and municipality of Fenton. These long-time owners have done a beautiful job of keeping their home meticulously maintained while updating the kitchen, baths and systems in the past 15 years. The area is quiet and secure with friendly neighbors. Open floor plan will accommodate your guests easily while everyone socializes, nonetheless, they will be drawn to sit on the covered deck and watch the kids play soccer or baseball in the huge level backyard. The huge finished lower level offers another living area and bar with a full bath right off the walkout door, perfect if you plan to build a pool! The neighborhood offers block parties for the entire family and school bus stops at the corner so you can watch your kids load and unload. Gravois Bluffs offers a huge variety of stores; Fenton has many parks & a new SSM St. Clare’s Health Center. (Hardwood floors under carpeting in bedrms, unsure about LR/DR).
ⓘ Source: listings_history table (triggers on properties + properties_extension) + one-shot
backfill from property_details.listing_events for pre-trigger history.
Tax reassessment forecast MO · Resets to sale price
- Current annual tax
- $3,054 · $255/mo
- Projected year-2 tax
- $3,473 · $289/mo
- Expected delta
- +$418/yr (+$35/mo · 13.7%)
ⓘ Screening estimate from a state-policy table — verify with the county assessor before closing.
Climate risk First Street
- Flood 6/10 Major FEMA zone X (unshaded) · 72% chance over 30 yrs
- Wildfire 3/10 Moderate
- Heat 5/10 Major 7 d/yr ≥107°F today · 21 d/yr by 30 yrs out
- Wind 2/10 Low 100% chance of damaging wind over 30 yrs
- Air quality 2/10 Low 1 unhealthy d/yr today · 2 by 30 yrs out
Nearby sold comps map
Loading sold comps map…
Walkable amenities ~0.75 mi
Loading nearby amenities…
Taxation est. · year 1
- Rental income
- $18,682
- − Mortgage interest
- −$20,054
- − Property taxes
- −$3,054
- − Insurance
- −$1,790
- − Repairs & maintenance
- −$1,495
- − Management
- −$1,495
- − Depreciation
- −$10,415
- Taxable loss
- −$19,619
- Est. tax savings @ 24.0%
- +$4,709
- After-tax cash flow
- $-7,905/yr
For passive investors: Depreciation is non-cash, so a rental often shows a tax loss while cash-flowing — sheltering income. Rental losses are passive: they offset passive income freely, and up to $25,000/yr can offset ordinary (W-2) income if you actively participate and your MAGI is under $100k (phasing out to $0 by $150k); unused losses carry forward. On sale, claimed depreciation is recaptured at up to 25%, and gains may owe capital-gains tax (a 1031 exchange can defer both). Figures are a year-1 estimate at your 24.0% rate — not tax advice; consult a CPA.
Schools (NCES district)
- District
- Lindbergh Schools
- NCES district ID
- 2918690
- Math proficiency
- 41% ▼ -18.00%
- Reading proficiency
- 55% ▼ -9.00%
- Median HH income
- $66,145
- Composite
- 42.62/100
- National rank
- #3186
- State rank
- #38 of 324 in MO
Livability — Fenton
- Score
- 74/100
- State rank
- #65
- US rank
- #4484
Category grades
Schools grade is shown separately in the Schools card above.
Census & demographics
- Census place
- Fenton, MO
- County
- Jefferson County · 108,544 people
- City population
- 45,354
- Metro
- St. Louis, MO-IL
- Population (ZIP)
- 45,354
- Household income
- $97,553
- Rent vs Own
- Severe rent burden
- 513.0
Population outlook (St. Louis County) Hauer SSP2
- Today (2025)
- 1,025,227 people
- By 2030
- 1,028,023 · +0.3%
- By 2040
- 1,020,940 · -0.4%
- By 2050
- 1,007,280 · -1.8%
- By 2075
- 987,277 · -3.7%
- By 2100
- 921,984 · -10.1%
Race, ethnicity, and origin ACS 2023
- Neighborhood character
- Predominantly White (87%)
- Race & ethnicity
- White 87% Two or more races 8% Hispanic / Latino 3% Asian 2% Black 1%
- Common ancestry
- Romanian 4% Lithuanian 3% Slovak 1%
- Foreign-born
- 3% · Canada, China
- Languages at home
- 95% English-only · Spanish 1% Russian/Polish/Slavic 1% Other Indo-European 1%
Political lean MEDSL · St. Louis
- 2024 margin
- Strong D (+23.4) · D 60.8% · R 37.4% · Other 1.7%
- 2008→2024 swing
- +3.5pp toward D · 2008: 19.9pp · 2024: 23.4pp
- All cycles
- 2024: D+23.4 2020: D+24.0 2016: D+16.2 2012: D+13.7 2008: D+19.9
Not yet ingested
- Civics
- —
Market trends
- HPI YoY
- ▼ -300.59%
- Current HPI
- 211.8944
- Rent YoY
- ▲ 7.72%
- Metro
- St. Louis, MO-IL
- State GDP YoY
- ▲ 1.84%
- F500 in state
- 20
Industry mix (Fortune 500 HQ in MO)
| Industry | F500 HQs | Revenue |
|---|---|---|
| Healthcare | 1 | $163B |
|
||
| Insurance | 1 | $21B |
|
||
| Industrial Technology | 1 | $17B |
|
||
| Retail | 1 | $16B |
|
||
| Industrial Distribution | 1 | $10B |
|
||
| Utilities | 1 | $9B |
|
||
Price history
+104.7% since first listed12 events — show timeline
- 2026-06-08 Pending — MARIS as Distributed by MLS Grid
- 2026-05-19 Contingent — MARIS as Distributed by MLS Grid
- 2026-05-15 Listed $358,000 MARIS as Distributed by MLS Grid
- 2026-05-14 Coming Soon $358,000 MARIS as Distributed by MLS Grid
- 2018-05-07 Sold (Public Records) $213,500 Public Records
- 2018-05-01 Sold (MLS) — MARIS as Distributed by MLS Grid
- 2018-03-26 Pending — MARIS as Distributed by MLS Grid
- 2018-03-22 Listed $199,900 MARIS as Distributed by MLS Grid
- 2018-03-20 Coming Soon $199,900 MARIS as Distributed by MLS Grid
- 2014-05-28 Sold (Public Records) $174,900 Public Records
- 2014-05-22 Sold (MLS) — MARIS as Distributed by MLS Grid
- 2014-03-26 Listed $174,900 MARIS as Distributed by MLS Grid
Property tax history
+6.0%/yrLatest (2022): $3,054 · +0.5% YoY. Source: county tax records.
Cash-flow waterfall
monthlySold comps — $/sqft
last 12 mo · ≤1 miLoading sold comps…