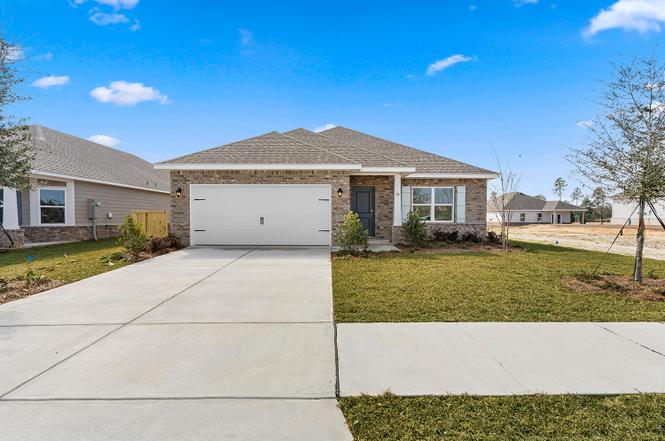
36 Natureview Way
Freeport, FL 32439
$377,990F
4 bd · 2.0 ba ·
1,825 sqft ·
Built 2026
· Land
· Active
· 125 DOM
Cashflow @ list (25.0% down · 7.5%)
Estimated rent
$2,427/mo
Mortgage (P&I)
−$1,982
Tax + insurance
−$630
HOA
−$45
Vac / Maint / Mgmt
−$510
Net cashflow
$-740/mo
Annual
$-8,881/yr
Cap rate
3.94%
Cash-on-cash
-8.39%
DSCR
0.63
1% rule
0.64%
Cash to close
$105,837
Investor read
- This is a 4-bed/2.0-bath land listed at $378k.
- At list price, monthly cash flow is $-740 ($-9k/yr) — negative.
- To cash-flow at today's rent, offer at most $271k (28.3% below list).
- To meet the 1% rule (rent ≥ 1% of price), the offer needs to be $243k (35.8% below list).
- It's been on market 125 days — a 12% lower offer ($333k) is reasonable based on typical stale-listing flexibility.
- Recommended offer: $243k (35.8% below list) — sets the bar for 1% rule.
- Local home prices are declining (-3.0%/yr); year-one equity from $3k of loan paydown is wiped out by about $11k of value loss. Plan a longer hold.
- Location reads 68/100 on livability (#520 in FL) — a middle-class / working-renter tenant base. Strengths: crime A+, housing A+, employment B+; Watch: health & safety C-, amenities F, commute F.
- Walton (rural): math 62% / reading 61% proficiency, ranked #10 of 73 in FL (top 14%) — acceptable for families but not a draw, mixed tenant base, ~2y average lease.
- Zoned schools: Freeport Elementary School (math 50% / reading 57%, grade C, #949 of 2,144 statewide, top 45%, 1,123 students, 55% FRL); Emerald Coast Middle School (math 70% / reading 65%, grade A-, #77 of 571 statewide, top 14%, 868 students, 24% FRL); Freeport Senior High School (math 47% / reading 62%, grade C-, #138 of 667 statewide, top 21%, 557 students, 43% FRL).
- Market conditions: Rents rising (+1.4%/yr); 1020 active listings in the ZIP; solid renter incomes; 2,883 units permitted in Walton County in 2024 (1,322 in 5+ unit buildings).
- Walton County population projected at +46% by 2050 — long-run rental-demand tailwind backs the buy-and-hold thesis.
- 11 sale attempts with the ask held roughly flat each time — persistent listings suggest the price (not the market) is what's stuck; bring a comps-based counter.
- Cap rate 3.9% vs local median 3.0% in Freeport — top-decile yield for the area; either an underpriced asset or a hidden risk that comps aren't pricing in. Stress-test before assuming the spread holds.
- This rent runs 35% of the median local income ($83k/yr) — at the standard rent-burdened threshold; future hikes will face affordability resistance.
Questions for listing agent
- What do current leases actually rent for vs. the listed asking? Can we see a recent rent roll and the last 12 months of T-12 income?
- It's been on market 125 days. Have you received any prior offers? Is the seller open to a 36% concession, seller financing, or rate buy-down credit?
- What does the HOA fee cover, when was the last increase, and are there any pending special assessments or reserve-fund shortfalls?
- Why hasn't it sold? Are there any deal-killer items the seller is aware of (foundation, flood, title, zoning, code violations)?
- Is there a deadline driving the sale (1031 exchange, divorce, estate, relocation)? That informs how much negotiation room exists.
- The area grade is low — what's the realistic commute time and amenity access for the typical tenant pool here? Any planned neighborhood developments (good or bad) we should know about?
- What's the average days-on-market for RENTAL listings here right now (not sales)? A rising rental-DOM trend means longer vacancies and softer asking-rent achievability than the comps imply.
- What's the recent tenant-quality profile in this submarket — average credit score on applications, eviction rate, late-payment / NSF rate, and stable-employment percentage? A property-management company in the area should have these aggregated.
CashFlowRE · CFR-WK39N17GMG892Y
· Data 17 h ago
cashflowre.app · 2026-05-29