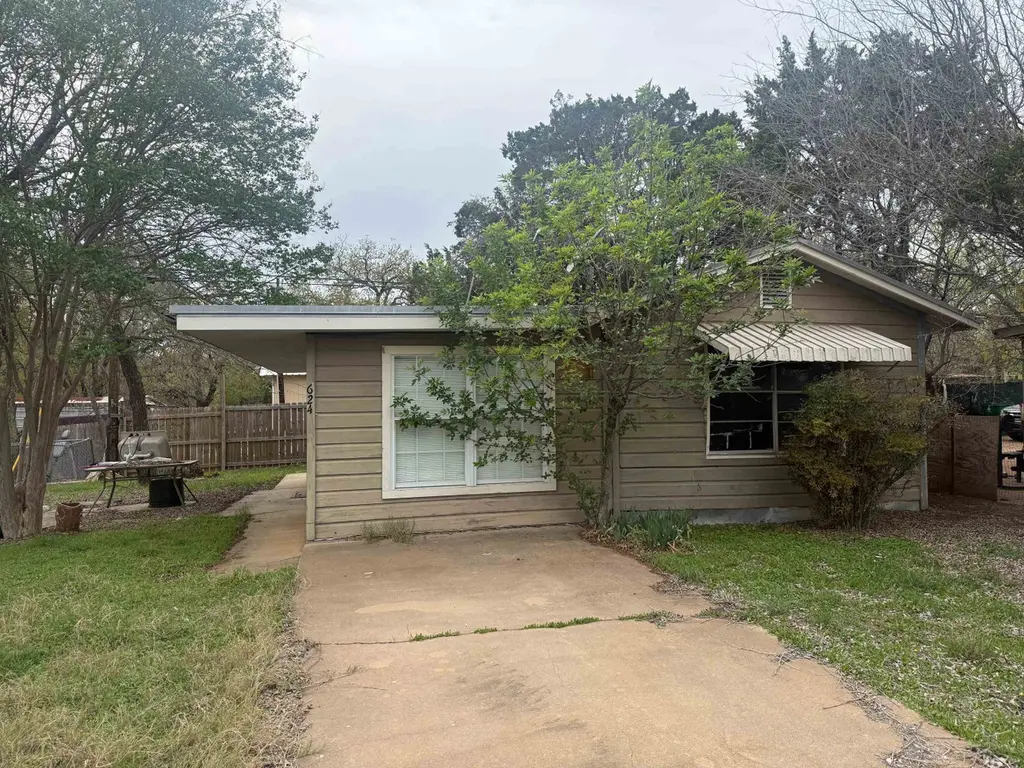
624 Driftwood Ln Ln
Cottonwood Shores, TX 78657
$89,000B
2 bd · 1.0 ba ·
782 sqft ·
Built 1960
· SingleFamily
· Active
· 96 DOM
Cashflow @ list (25.0% down · 7.5%)
Estimated rent
$1,509/mo
Mortgage (P&I)
−$467
Tax + insurance
−$147
HOA
−$0
Vac / Maint / Mgmt
−$317
Net cashflow
$579/mo
Annual
$6,949/yr
Cap rate
14.10%
Cash-on-cash
27.89%
DSCR
2.24
1% rule
1.70%
Cash to close
$24,920
Investor read
- This is a 2-bed/1.0-bath single-family listed at $89k.
- At list price, monthly cash flow is $579 ($7k/yr) — positive.
- The deal already cash-flows at list — no discount required.
- Meets the 1% rule at list price ($2k rent vs $89k).
- It's been on market 96 days — a 9% lower offer ($81k) is reasonable based on typical stale-listing flexibility.
- Recommended offer: $81k (9.0% below list) — sets the bar for market timing.
- In year one you build about $1k of equity ($615 loan paydown + $841 appreciation (0.9% local appreciation)).
- Location reads 70/100 on livability (#385 in TX) — a middle-class / working-renter tenant base. Strengths: crime A+, cost of living A+, housing A+; Watch: amenities F, commute F, employment F.
- Marble Falls ISD (town): math 32% / reading 38% proficiency, ranked #511 of 826 in TX (top 62%) — families likely to look elsewhere, expect single-tenant / working-renter base with shorter leases.
- Zoned schools: Colt El (math 35% / reading 38%, grade F, #1,883 of 4,322 statewide, top 44%, 644 students, 62% FRL); Marble Falls Middle (math 32% / reading 37%, grade F, #858 of 1,662 statewide, top 54%, 911 students, 67% FRL); Marble Falls H S (math 29% / reading 47%, grade F, #880 of 1,632 statewide, top 54%, 1,145 students, 61% FRL).
- Market conditions: 1236 active listings in the ZIP; 1 comparable units currently listed for rent nearby; solid renter incomes; 891 units permitted in Burnet County in 2024 (76 in 5+ unit buildings).
- Burnet County population projected at +22% by 2050 — long-run rental-demand tailwind backs the buy-and-hold thesis.
- At projected returns (0.9% appreciation + 3.0% rent growth), your $25k cash investment doubles in ~3 years — after that, you're playing with house money.
- Climate carrying-cost: major wind risk, 55% chance of damaging wind over 30y; moderate wildfire risk; extreme-heat days projected 7→23/yr by 2055 (HVAC capex compounding) — expect insurance premiums to compound above CPI over the hold.
- Cap rate 14.1% vs local median 4.2% in Cottonwood Shores — top-decile yield for the area; either an underpriced asset or a hidden risk that comps aren't pricing in. Stress-test before assuming the spread holds.
Questions for listing agent
- It's been on market 96 days. Have you received any prior offers? Is the seller open to a 9% concession, seller financing, or rate buy-down credit?
- Built in 1960 — when were the roof, HVAC, electrical panel, plumbing, and water heater last replaced?
- Why hasn't it sold? Are there any deal-killer items the seller is aware of (foundation, flood, title, zoning, code violations)?
- Is there a deadline driving the sale (1031 exchange, divorce, estate, relocation)? That informs how much negotiation room exists.
- Schools are F-rated, which usually means shorter tenancies and higher turnover. Who's the typical renter profile here, and what's been the actual vacancy rate?
- What's the average days-on-market for RENTAL listings here right now (not sales)? A rising rental-DOM trend means longer vacancies and softer asking-rent achievability than the comps imply.
- What's the recent tenant-quality profile in this submarket — average credit score on applications, eviction rate, late-payment / NSF rate, and stable-employment percentage? A property-management company in the area should have these aggregated.
- How much new for-sale + rental construction is in the pipeline within 1–3 miles? Heavy new supply typically softens prices + rents 12–24 months out; constrained supply supports both.
CashFlowRE · CFR-WM3HRV64TES9ER
· Data 16 h ago
cashflowre.app · 2026-05-29