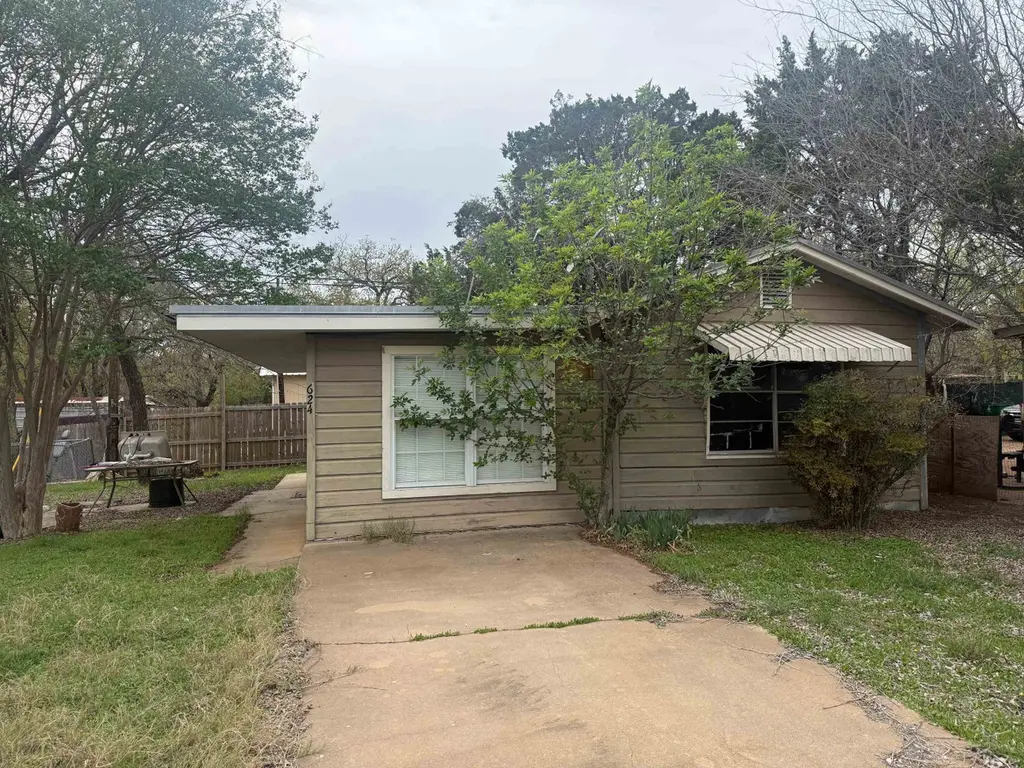
624 Driftwood Ln Ln · Cottonwood Shores, TX
Flood risk 1/10 · Minimal
- FEMA flood zone
- X (unshaded)
- Chance of flooding over 30 yrs
- 0.0%
- Est. flood insurance / yr
- $507 – $1,088
Fire risk 5/10 · Moderate
- Est. fire insurance / yr
- $1,222 – $2,270
Heat risk 8/10 · Major
- Hot days now (above 107°F)
- 7 days/yr
- Hot days in 30 yrs
- 23 days/yr
Wind risk 6/10 · Moderate
- Chance of severe wind over 30 yrs
- 55.0%
Air-quality risk 1/10 · Minimal
- Unhealthy air days now
- 0 days/yr
- Unhealthy air days in 30 yrs
- 0 days/yr
Risk factors via First Street. Map © Google.
Why this score? — see what drove the B grade
The composite is a weighted blend of 9 inputs, each scored 0–100. Each bar is that input's sub-score; the figure is the points it added to the 100-point composite (weight × sub-score).
- Cash flow +30.0/30.0
- 1% rule +10.0/10.0
- DSCR +10.0/10.0
- ARV discount +7.5/15.0
- Appreciation +5.5/10.0
- Livability +3.5/5.0
- Schools +3.0/10.0
- Rent growth +2.5/5.0
- Condition / age +2.5/5.0
$89,000
🖨 Deal sheet (PDF) 📄 Offer letter ✓ Due diligence
Listing remarks MLS
Investor special! This home sits on a level lot in Cottonwood Shores and is ready for a complete renovation or teardown. Great opportunity to build new or maximize value in an area experiencing growth. Enjoy community perks including Lake Marble Falls access, a park, and splash pad. Bring your vision—this one is priced for potential.
Key facts
- Community perks
- Splash pad
- 5,000 sq ft lot
Tags
Neighborhood map
What this means for you Summary
Snapshot
- This is a 2-bed/1.0-bath single-family listed at $89k.
Deal economics
- At list price, monthly cash flow is $579 ($7k/yr) — positive.
- The deal already cash-flows at list — no discount required.
- Meets the 1% rule at list price ($2k rent vs $89k).
- Recommended offer: $81k (9.0% below list) — sets the bar for market timing.
- Cap rate 14.1% vs local median 4.2% in Cottonwood Shores — top-decile yield for the area; either an underpriced asset or a hidden risk that comps aren't pricing in. Stress-test before assuming the spread holds.
Location & tenants
- Location reads 70/100 on livability (#385 in TX) — a middle-class / working-renter tenant base. Strengths: crime A+, cost of living A+, housing A+; Watch: amenities F, commute F, employment F.
- Marble Falls ISD (town): math 32% / reading 38% proficiency, ranked #511 of 826 in TX (top 62%) — families likely to look elsewhere, expect single-tenant / working-renter base with shorter leases.
- Zoned schools: Colt El (math 35% / reading 38%, grade F, #1,883 of 4,322 statewide, top 44%, 644 students, 62% FRL); Marble Falls Middle (math 32% / reading 37%, grade F, #858 of 1,662 statewide, top 54%, 911 students, 67% FRL); Marble Falls H S (math 29% / reading 47%, grade F, #880 of 1,632 statewide, top 54%, 1,145 students, 61% FRL).
- Market conditions: 1227 active listings in the ZIP; 1 comparable units currently listed for rent nearby; solid renter incomes; 891 units permitted in Burnet County in 2024 (76 in 5+ unit buildings).
Forward outlook
- In year one you build about $1k of equity ($615 loan paydown + $841 appreciation (0.9% local appreciation)).
- Burnet County population projected at +22% by 2050 — long-run rental-demand tailwind backs the buy-and-hold thesis.
- At projected returns (0.9% appreciation + 3.0% rent growth), your $25k cash investment doubles in ~3 years — after that, you're playing with house money.
Negotiation context
- It's been on market 96 days — a 9% lower offer ($81k) is reasonable based on typical stale-listing flexibility.
Risks & watch-outs
- Climate carrying-cost: major wind risk, 55% chance of damaging wind over 30y; moderate wildfire risk; extreme-heat days projected 7→23/yr by 2055 (HVAC capex compounding) — expect insurance premiums to compound above CPI over the hold.
Questions for the listing agent
- It's been on market 96 days. Have you received any prior offers? Is the seller open to a 9% concession, seller financing, or rate buy-down credit?
- Built in 1960 — when were the roof, HVAC, electrical panel, plumbing, and water heater last replaced?
- Why hasn't it sold? Are there any deal-killer items the seller is aware of (foundation, flood, title, zoning, code violations)?
- Is there a deadline driving the sale (1031 exchange, divorce, estate, relocation)? That informs how much negotiation room exists.
- Schools are F-rated, which usually means shorter tenancies and higher turnover. Who's the typical renter profile here, and what's been the actual vacancy rate?
- What's the average days-on-market for RENTAL listings here right now (not sales)? A rising rental-DOM trend means longer vacancies and softer asking-rent achievability than the comps imply.
- What's the recent tenant-quality profile in this submarket — average credit score on applications, eviction rate, late-payment / NSF rate, and stable-employment percentage? A property-management company in the area should have these aggregated.
- How much new for-sale + rental construction is in the pipeline within 1–3 miles? Heavy new supply typically softens prices + rents 12–24 months out; constrained supply supports both.
Investment metrics
- 1% rule
- 1.70% ✓
- Cap rate
- 14.10%
- Cash-on-cash
- 27.89%
- DSCR
- 2.24
- GRM
- 4.9
CMA / ARV
- ARV (median comp)
- $228,150
- List price
- $89,000
- Delta
- -60.99%
- Verdict
- UNDERPRICED
- Comps
- 4 within 1.0 mi
Show comp detail 2 sales within ~0.75 mi
| Address | Dist | Beds/Ba | Sqft | Sold | Price | $/sf | Match |
|---|---|---|---|---|---|---|---|
| 749 Driftwood Ln | 0.41mi | 2/1.0 | 792 (+1%) | 19mo | $195,000 | $246 | 63 |
| 833 Driftwood Ln | 0.63mi | 2/1.0 | 768 (-2%) | 15mo | $239,000 | $311 | 56 |
Match score weights: distance 35% · size 25% · config 20% · recency 20%. Top-matched comps best support the ARV.
Projected returns pro-forma
0.95% appreciation · 3.0% rent growth · sell at horizon
- IRR
- 30.1%
- Equity multiple
- 2.54×
- Total profit
- $38,331
- Equity at exit
- $30,130
- IRR
- 32.6%
- Equity multiple
- 4.91×
- Total profit
- $97,379
- Equity at exit
- $39,846
Cash invested: $24,920 (down + closing). Projections, not guarantees.
Landlord ↔ Tenant lean methodology
- Overall (STATE)
- 87 Strongly Landlord-Friendly
- State Texas
- 87 Strongly Landlord-Friendly · R+5
- County
- — inherits STATE
- City
- — inherits STATE
ZIP-level market 78657
- Home prices YoY
- 0.4%
- Active inventory
- 1227
- Price-to-rent
- 4.9×
Monthly cashflow live
- Estimated rent
- $1,509 medium interval (Pro) →
- Mortgage (P&I)
- −$467
- Tax from tax record
- −$109 /mo · $1,313/yr
- Insurance
- −$37
- HOA
- −$0
- Vacancy / Maint / Mgmt
- −$317
- Net cashflow
- $579
Break-even live
Sensitivity live
| Price | -10% $629 | -5% $604 | +0% $579 | +5% $554 | +10% $529 |
|---|---|---|---|---|---|
| Rent | -10% $460 | -5% $519 | +0% $579 | +5% $639 | +10% $698 |
| Rate | -1.0pp $624 | -0.5pp $602 | base $579 | +0.5pp $556 | +1.0pp $533 |
UW: 25.0% down · 7.5% · 30yr · 1.5% tax · 5.0% vac · 8.0% maint · 8.0% mgmt
Financing live
Cash to close
- Down payment
- $22,250
- Closing costs
- $2,670
- Reserves months
- —
- Total cash needed
- —
Loan-product check · same deal, 3 products live
Conventional
25% down · 7.5% · 30yr
- Down + closing
- —
- Monthly P&I
- —
- Monthly cashflow
- —
- DSCR
- —
- Eligible?
- —
Personal DTI + credit; lowest rate.
DSCR
20% down · 8.5% · 30yr
- Down + closing
- —
- Monthly P&I
- —
- Monthly cashflow
- —
- DSCR
- —
- Eligible?
- —
No personal income docs; deal must DSCR.
Hard money
10% down · 12.0% · 12mo
- Down + closing
- —
- Monthly P&I
- —
- Monthly cashflow
- —
- DSCR
- —
- Eligible?
- —
Short-term bridge; refi at stabilization.
Rent comps 1 comps
| Address | Beds | Baths | Sqft | Rent | $/sqft | DOM | Units | Dist |
|---|---|---|---|---|---|---|---|---|
| 723 Pecan Ln Cottonwood Shores, TX | 2.0 | 1.0 | 1027 | $1,400 | $1.36 | 46d | 1 | 0.32mi |
Listing history 20 events
-
2026-06-21days on market $89,000 Active 96 DOM
-
2026-06-18days on market $89,000 Active 93 DOM
-
2026-06-17days on market $89,000 Active 92 DOM
-
2026-06-16days on market $89,000 Active 91 DOM
-
2026-06-15days on market $89,000 Active 90 DOM
-
2026-06-13days on market $89,000 Active 88 DOM
-
2026-06-13days on market $89,000 Active 87 DOM
-
2026-06-09days on market $89,000 Active 84 DOM
-
2026-06-08days on market $89,000 Active 83 DOM
-
2026-06-07days on market $89,000 Active 82 DOM
-
2026-06-05days on market $89,000 Active 79 DOM
-
2026-06-03days on market $89,000 Active 78 DOM
-
2026-06-01days on market $89,000 Active 76 DOM
-
2026-05-31days on market $89,000 Active 75 DOM
-
2026-03-17$89,000 Active 341-char remark
Show marketing remark (341 chars)
Investor special! This home sits on a level lot in Cottonwood Shores and is ready for a complete renovation or teardown. Great opportunity to build new or maximize value in an area experiencing growth. Enjoy community perks including Lake Marble Falls access, a park, and splash pad. Bring your vision—this one is priced for potential.
-
2017-02-14soldstatus
-
2014-04-15soldstatus
-
2008-05-14soldstatus
-
2005-07-25soldstatus
-
1995-11-02soldstatus
ⓘ Source: listings_history table (triggers on properties + properties_extension) + one-shot
backfill from property_details.listing_events for pre-trigger history.
Tax reassessment forecast TX · Resets to sale price
- Current annual tax
- $1,313 · $109/mo
- Projected year-2 tax
- $1,629 · $136/mo
- Expected delta
- +$315/yr (+$26/mo · 24.0%)
ⓘ Screening estimate from a state-policy table — verify with the county assessor before closing.
Climate risk First Street
- Flood 1/10 Low FEMA zone X (unshaded) · 0% chance over 30 yrs
- Wildfire 5/10 Major
- Heat 8/10 Severe 7 d/yr ≥107°F today · 23 d/yr by 30 yrs out
- Wind 6/10 Major 55% chance of damaging wind over 30 yrs
- Air quality 1/10 Low 0 unhealthy d/yr today · 0 by 30 yrs out
Nearby sold comps map
Loading sold comps map…
Walkable amenities ~0.75 mi
Loading nearby amenities…
Taxation est. · year 1
- Rental income
- $18,111
- − Mortgage interest
- −$4,985
- − Property taxes
- −$1,313
- − Insurance
- −$445
- − Repairs & maintenance
- −$1,449
- − Management
- −$1,449
- − Depreciation
- −$2,589
- Taxable income
- $5,881
- Est. tax owed @ 24.0%
- −$1,411
- After-tax cash flow
- $5,538/yr
For passive investors: Depreciation is non-cash, so a rental often shows a tax loss while cash-flowing — sheltering income. Rental losses are passive: they offset passive income freely, and up to $25,000/yr can offset ordinary (W-2) income if you actively participate and your MAGI is under $100k (phasing out to $0 by $150k); unused losses carry forward. On sale, claimed depreciation is recaptured at up to 25%, and gains may owe capital-gains tax (a 1031 exchange can defer both). Figures are a year-1 estimate at your 24.0% rate — not tax advice; consult a CPA.
Schools (NCES district)
- District
- Marble Falls ISD
- NCES district ID
- 4829010
- Math proficiency
- 32% ▼ -8.00%
- Reading proficiency
- 38% ▼ -4.00%
- Median HH income
- $49,663
- Composite
- 30.3/100
- National rank
- #6278
- State rank
- #511 of 826 in TX
Livability — Cottonwood Shores
- Score
- 70/100
- State rank
- #385
- US rank
- #8036
Category grades
Schools grade is shown separately in the Schools card above.
Census & demographics
- Census place
- Cottonwood Shores, TX
- County
- Llano County · 16,310 people
- Metro
- nan
- Population (ZIP)
- 7,591
- Household income
- $91,452
- Rent vs Own
- Severe rent burden
- 45.0
Population outlook (Burnet County) Hauer SSP2
- Today (2025)
- 50,492 people
- By 2030
- 52,995 · +5.0%
- By 2040
- 57,528 · +13.9%
- By 2050
- 61,444 · +21.7%
- By 2075
- 71,098 · +40.8%
- By 2100
- 74,634 · +47.8%
Race, ethnicity, and origin ACS 2023
- Neighborhood character
- Predominantly White (80%)
- Race & ethnicity
- White 80% Hispanic / Latino 16% Two or more races 8% Asian 1%
- Hispanic origin (detail)
- Mexican 14%
- Common ancestry
- Slovak 3% Portuguese 3% Italian 2%
- Foreign-born
- 8% · Canada
- Languages at home
- 87% English-only · Spanish 12% Other Indo-European 1%
Political lean MEDSL · Burnet
- 2024 margin
- Solid R (+55.7) · D 21.7% · R 77.4%
- 2008→2024 swing
- -11.6pp toward R · 2008: -44.1pp · 2024: -55.7pp
- All cycles
- 2024: R+55.7 2020: R+53.1 2016: R+56.8 2012: R+54.6 2008: R+44.1
Not yet ingested
- Civics
- —
Market trends
- HPI YoY
- ▲ 0.95%
- Current HPI
- 229.9918
- Rent YoY
- —
- Metro
- nan
- State GDP YoY
- ▲ 3.95%
- F500 in state
- 110
Industry mix (Fortune 500 HQ in TX)
| Industry | F500 HQs | Revenue |
|---|---|---|
| Energy | 16 | $1,198B |
|
||
| Technology | 5 | $198B |
|
||
| Engineering / Construction | 4 | $72B |
|
||
| Energy Services | 3 | $60B |
|
||
| Utilities | 3 | $41B |
|
||
| Healthcare | 2 | $330B |
|
||
Price history
6 events — show timeline
- 2026-03-17 Listed $89,000 HLMLS as distributed by MLS GRID
- 2017-02-14 Sold (Public Records) — Public Records
- 2014-04-15 Sold (Public Records) — Public Records
- 2008-05-14 Sold (Public Records) — Public Records
- 2005-07-25 Sold (Public Records) — Public Records
- 1995-11-02 Sold (Public Records) — Public Records
Property tax history
+9.3%/yrLatest (2026): $1,313 · +0.0% YoY. Source: county tax records.
Cash-flow waterfall
monthlySold comps — $/sqft
last 12 mo · ≤1 miLoading sold comps…