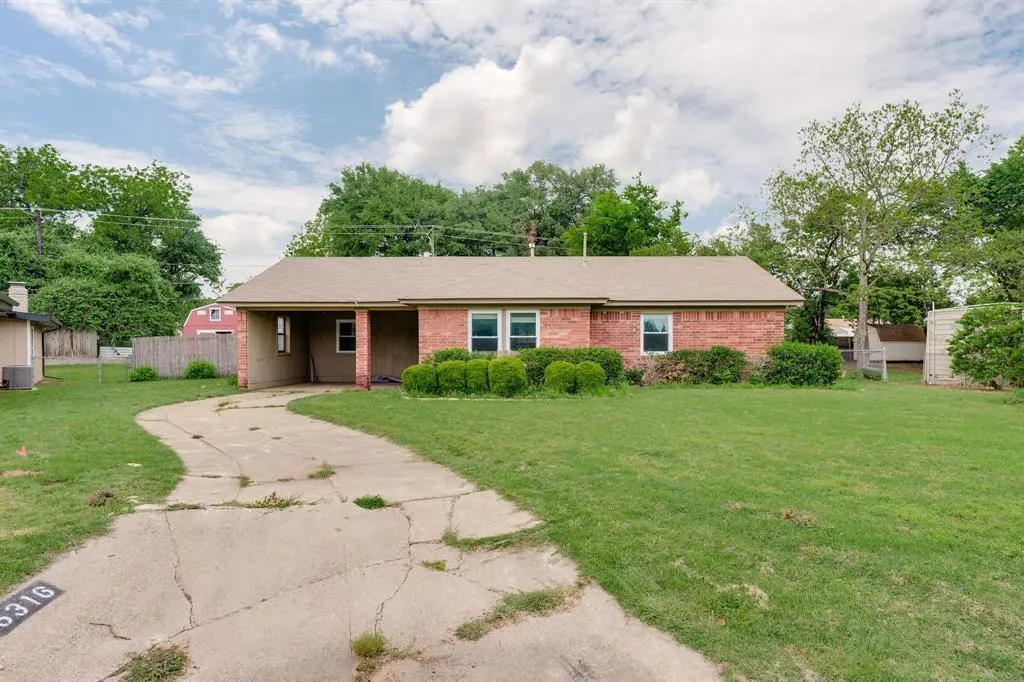
5316 Cahill Oval St
River Oaks, TX 76114
$199,000D+
3 bd · 2.0 ba ·
1,372 sqft ·
Built 1951
· SingleFamily
· Pending
· 14 DOM
Cashflow @ list (25.0% down · 7.5%)
Estimated rent
$2,024/mo
Mortgage (P&I)
−$1,044
Tax + insurance
−$517
HOA
−$0
Vac / Maint / Mgmt
−$425
Net cashflow
$39/mo
Annual
$463/yr
Cap rate
6.53%
Cash-on-cash
0.83%
DSCR
1.04
1% rule
1.02%
Cash to close
$55,720
Investor read
- This is a 3-bed/2.0-bath single-family listed at $199k.
- At list price, monthly cash flow is $39 ($463/yr) — positive.
- The deal already cash-flows at list — no discount required.
- Meets the 1% rule at list price ($2k rent vs $199k).
- Only 14 days on market — expect competitive offers; lowballing is unlikely to land.
- Local home prices are declining (-3.0%/yr); year-one equity from $1k of loan paydown is wiped out by about $6k of value loss. Plan a longer hold.
- Location reads 72/100 on livability (#237 in TX) — a middle-class / working-renter tenant base. Strengths: cost of living A+, housing A+, health & safety A+; Watch: amenities F, commute F.
- Castleberry ISD (suburban): math 21% / reading 32% proficiency, ranked #701 of 826 in TX (top 85%) — low school quality limits family demand, transient renter base, plan for 1-2y turnover; 72% free/reduced lunch — lower-income household profile, screen leases tightly.
- Zoned schools: Castleberry El (math 17% / reading 26%, grade F, #3,470 of 4,322 statewide, top 81%, 747 students, 88% FRL); Irma Marsh Middle (math 21% / reading 32%, grade F, #1,200 of 1,662 statewide, top 73%, 853 students, 88% FRL); Castleberry H S (math 23% / reading 43%, grade F, #1,023 of 1,632 statewide, top 63%, 1,042 students, 85% FRL).
- Watch-outs: property tax is 2.6% of price; built in 1951 — expect roof / HVAC / electrical / plumbing capex.
- Market conditions: Rents rising (+1.9%/yr); 156 active listings in the ZIP; 40 comparable units currently listed for rent nearby; rentals at typical pace (median 15d on market — plan ~3-4 weeks tenant-placement turnaround); 18,938 units permitted in Tarrant County in 2024 (8,336 in 5+ unit buildings).
- Tarrant County population projected at +41% by 2050 — long-run rental-demand tailwind backs the buy-and-hold thesis.
- Climate carrying-cost: major wind risk, 27% chance of damaging wind over 30y; extreme-heat days projected 7→23/yr by 2055 (HVAC capex compounding) — expect insurance premiums to compound above CPI over the hold.
- This rent runs 39% of the median local income ($62k/yr) — at the standard rent-burdened threshold; future hikes will face affordability resistance.
Questions for listing agent
- Built in 1951 — when were the roof, HVAC, electrical panel, plumbing, and water heater last replaced?
- Property tax is high relative to price — has the assessment been appealed recently, and will the sale trigger a re-assessment?
- Is there a deadline driving the sale (1031 exchange, divorce, estate, relocation)? That informs how much negotiation room exists.
- Schools are B-rated — typically a magnet for longer-tenancy family renters. What's the average tenant stay here, and is there a school-zone premium baked into asking?
- The area grade is low — what's the realistic commute time and amenity access for the typical tenant pool here? Any planned neighborhood developments (good or bad) we should know about?
- What's the average days-on-market for RENTAL listings here right now (not sales)? A rising rental-DOM trend means longer vacancies and softer asking-rent achievability than the comps imply.
- What's the recent tenant-quality profile in this submarket — average credit score on applications, eviction rate, late-payment / NSF rate, and stable-employment percentage? A property-management company in the area should have these aggregated.
- How much new for-sale + rental construction is in the pipeline within 1–3 miles? Heavy new supply typically softens prices + rents 12–24 months out; constrained supply supports both.
CashFlowRE · CFR-WM69ZVE003EG7H
· Data 4 weeks ago
cashflowre.app · 2026-05-29