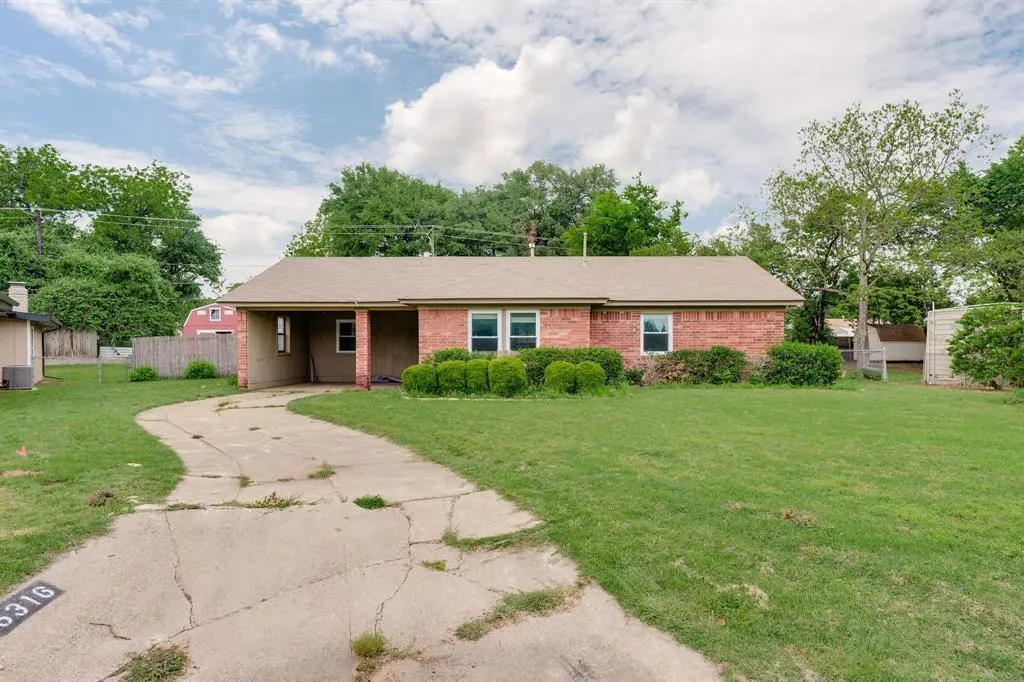
5316 Cahill Oval St · River Oaks, TX
Flood risk 1/10 · Minimal
- FEMA flood zone
- X (unshaded)
- Chance of flooding over 30 yrs
- 0.0%
- Est. flood insurance / yr
- $507 – $1,088
Fire risk 3/10 · Minor
- Est. fire insurance / yr
- $1,222 – $2,270
Heat risk 7/10 · Major
- Hot days now (above 109°F)
- 7 days/yr
- Hot days in 30 yrs
- 23 days/yr
Wind risk 6/10 · Moderate
- Chance of severe wind over 30 yrs
- 27.0%
Air-quality risk 3/10 · Minor
- Unhealthy air days now
- 3 days/yr
- Unhealthy air days in 30 yrs
- 4 days/yr
Risk factors via First Street. Map © Google.
Why this score? — see what drove the D+ grade
The composite is a weighted blend of 9 inputs, each scored 0–100. Each bar is that input's sub-score; the figure is the points it added to the 100-point composite (weight × sub-score).
- Cash flow +14.4/30.0
- ARV discount +14.3/15.0
- 1% rule +5.2/10.0
- DSCR +4.4/10.0
- Livability +3.6/5.0
- Rent growth +3.0/5.0
- Condition / age +2.5/5.0
- Schools +2.2/10.0
- Appreciation +0.0/10.0
$199,000
🖨 Deal sheet (PDF) 📄 Offer letter ✓ Due diligence
Listing remarks
Welcome to this beautifully maintained 3-bedroom, 1-bathroom home nestled on a generous lot. Enjoy beautiful wood floors and a great kitchen layout, a bathroom that is super functional to the home. Off the kitchen is a bonus room that would make a great home office and acts as a great flex room. This home has a new HVAC system and all new windows throughout. The large yard offers plenty of space for outdoor living and is situated on a great cul-de-sac lot. Don’t miss this opportunity to own a move-in-ready home. Situated on a nice sized lot in highly desirable Castleberry ISD, this home is just minutes from new restaurants, shopping, and local amenities, giving you convenience without
Key facts
- Wood floors
- Great kitchen layout
- Bonus room
Tags
Property features AI
Finance
- Other: Listing is for sale (standard listing, exclusive right to sell)
- Financial info: Listing accepts Cash, Conventional, and VA financing
- HOA & community: No homeowners association
Exterior
- Parking: Carport with 2 covered spaces; Driveway parking
- Utilities: City water; City sewer; Not in a municipal utility district
- Home design: Single-family residence; Residential property; Built in 1951; Not attached to another unit
- Construction: Preowned home (built 1951)
- Exterior features: Lot under 0.5 acre (approximately 0.176 acre); Subdivision: Seven Oaks Add
Interior
- Kitchen: Dishwasher; Disposal; Electric cooktop; Electric oven
- Bedrooms: Three bedrooms (all on the main level); Primary bedroom on the main level
- Bathrooms: One full bathroom
- Heating & cooling: Central heating; Central air conditioning; Ceiling fans
- Interior features: One-level layout; Five total rooms; One living area; One dining area; Other interior features
Neighborhood map
What this means for you Summary
Snapshot
- This is a 3-bed/2.0-bath single-family listed at $199k.
Deal economics
- At list price, monthly cash flow is $39 ($463/yr) — positive.
- The deal already cash-flows at list — no discount required.
- Meets the 1% rule at list price ($2k rent vs $199k).
Location & tenants
- Location reads 72/100 on livability (#237 in TX) — a middle-class / working-renter tenant base. Strengths: cost of living A+, housing A+, health & safety A+; Watch: amenities F, commute F.
- Castleberry ISD (suburban): math 21% / reading 32% proficiency, ranked #701 of 826 in TX (top 85%) — low school quality limits family demand, transient renter base, plan for 1-2y turnover; 72% free/reduced lunch — lower-income household profile, screen leases tightly.
- Zoned schools: Castleberry El (math 17% / reading 26%, grade F, #3,470 of 4,322 statewide, top 81%, 747 students, 88% FRL); Irma Marsh Middle (math 21% / reading 32%, grade F, #1,200 of 1,662 statewide, top 73%, 853 students, 88% FRL); Castleberry H S (math 23% / reading 43%, grade F, #1,023 of 1,632 statewide, top 63%, 1,042 students, 85% FRL).
- Market conditions: Rents rising (+1.9%/yr); 152 active listings in the ZIP; 40 comparable units currently listed for rent nearby; rentals at typical pace (median 15d on market — plan ~3-4 weeks tenant-placement turnaround); 18,938 units permitted in Tarrant County in 2024 (8,336 in 5+ unit buildings).
- This rent runs 39% of the median local income ($62k/yr) — at the standard rent-burdened threshold; future hikes will face affordability resistance.
Forward outlook
- Local home prices are declining (-3.0%/yr); year-one equity from $1k of loan paydown is wiped out by about $6k of value loss. Plan a longer hold.
- Tarrant County population projected at +41% by 2050 — long-run rental-demand tailwind backs the buy-and-hold thesis.
Negotiation context
- Only 14 days on market — expect competitive offers; lowballing is unlikely to land.
Risks & watch-outs
- Watch-outs: property tax is 2.6% of price; built in 1951 — expect roof / HVAC / electrical / plumbing capex.
- Climate carrying-cost: major wind risk, 27% chance of damaging wind over 30y; extreme-heat days projected 7→23/yr by 2055 (HVAC capex compounding) — expect insurance premiums to compound above CPI over the hold.
Questions for the listing agent
- Built in 1951 — when were the roof, HVAC, electrical panel, plumbing, and water heater last replaced?
- Property tax is high relative to price — has the assessment been appealed recently, and will the sale trigger a re-assessment?
- Is there a deadline driving the sale (1031 exchange, divorce, estate, relocation)? That informs how much negotiation room exists.
- Schools are B-rated — typically a magnet for longer-tenancy family renters. What's the average tenant stay here, and is there a school-zone premium baked into asking?
- The area grade is low — what's the realistic commute time and amenity access for the typical tenant pool here? Any planned neighborhood developments (good or bad) we should know about?
- What's the average days-on-market for RENTAL listings here right now (not sales)? A rising rental-DOM trend means longer vacancies and softer asking-rent achievability than the comps imply.
- What's the recent tenant-quality profile in this submarket — average credit score on applications, eviction rate, late-payment / NSF rate, and stable-employment percentage? A property-management company in the area should have these aggregated.
- How much new for-sale + rental construction is in the pipeline within 1–3 miles? Heavy new supply typically softens prices + rents 12–24 months out; constrained supply supports both.
Investment metrics
- 1% rule
- 1.02% ✓
- Cap rate
- 6.53%
- Cash-on-cash
- 0.83%
- DSCR
- 1.04
- GRM
- 8.2
CMA / ARV
- ARV (median comp)
- $234,500
- List price
- $199,000
- Delta
- -15.14%
- Verdict
- UNDERPRICED
- Comps
- 20 within 1.0 mi
Show comp detail 12 sales within ~0.75 mi
| Address | Dist | Beds/Ba | Sqft | Sold | Price | $/sf | Match |
|---|---|---|---|---|---|---|---|
| 5316 Cahill Oval St | 0.00mi | 3/1.0 | 1,372 (0%) | 0mo | $199,000 | $145 | 96 |
| 5320 Cahill Oval St | 0.01mi | 3/2.0 | 1,459 (+6%) | 3mo | $239,000 | $164 | 86 |
| 5432 Thomas Ln | 0.14mi | 3/1.0 | 1,291 (-6%) | 1mo | $230,000 | $178 | 78 |
| 5236 Park Dr | 0.09mi | 2/2.0 (-1) | 1,425 (+4%) | 8mo | $325,000 | $228 | 78 |
| 4812 Blackstone Dr | 0.45mi | 3/2.0 | 1,373 (+0%) | 11mo | $176,000 | $128 | 70 |
| 5709 N Schilder Dr | 0.56mi | 3/2.0 | 1,396 (+2%) | 3mo | $325,000 | $233 | 69 |
| 4901 Barbara Rd | 0.45mi | 3/2.0 | 1,492 (+9%) | 7mo | $219,900 | $147 | 58 |
| 6050 Douglas St | 0.74mi | 3/1.5 | 1,344 (-2%) | 2mo | $239,000 | $178 | 58 |
| 133 Mcgee Dr | 0.50mi | 3/2.0 | 1,214 (-12%) | 1mo | $299,900 | $247 | 57 |
| 907 Hallum St | 0.58mi | 3/1.0 | 1,302 (-5%) | 12mo | $279,900 | $215 | 51 |
| 5716 N Wells Cir | 0.68mi | 4/2.0 (+1) | 1,556 (+13%) | 1mo | $325,900 | $209 | 40 |
| 5907 Douglas St | 0.68mi | 3/2.0 | 1,176 (-14%) | 7mo | $289,000 | $246 | 38 |
Match score weights: distance 35% · size 25% · config 20% · recency 20%. Top-matched comps best support the ARV.
Projected returns pro-forma
-3.0% appreciation · 1.88% rent growth · sell at horizon
- IRR
- -16.3%
- Equity multiple
- 0.43×
- Total profit
- $-31,900
- Equity at exit
- $29,672
- IRR
- -10.3%
- Equity multiple
- 0.41×
- Total profit
- $-33,078
- Equity at exit
- $17,206
Cash invested: $55,720 (down + closing). Projections, not guarantees.
Landlord ↔ Tenant lean methodology
- Overall (STATE)
- 87 Strongly Landlord-Friendly
- State Texas
- 87 Strongly Landlord-Friendly · R+5
- County
- — inherits STATE
- City
- — inherits STATE
ZIP-level market 76114
- Home prices YoY
- -24.3%
- Rents YoY
- 1.9%
- Active inventory
- 152
- Price-to-rent
- 8.2×
Monthly cashflow live
- Estimated rent
- $2,024 high interval (Pro) →
- Mortgage (P&I)
- −$1,044
- Tax from tax record
- −$434 /mo · $5,211/yr
- Insurance
- −$83
- HOA
- −$0
- Vacancy / Maint / Mgmt
- −$425
- Net cashflow
- $39
Break-even live
Sensitivity live
| Price | -10% $151 | -5% $95 | +0% $39 | +5% $-18 | +10% $-74 |
|---|---|---|---|---|---|
| Rent | -10% $-121 | -5% $-41 | +0% $39 | +5% $119 | +10% $199 |
| Rate | -1.0pp $139 | -0.5pp $89 | base $39 | +0.5pp $-13 | +1.0pp $-65 |
UW: 25.0% down · 7.5% · 30yr · 1.5% tax · 5.0% vac · 8.0% maint · 8.0% mgmt
Financing live
Cash to close
- Down payment
- $49,750
- Closing costs
- $5,970
- Reserves months
- —
- Total cash needed
- —
Loan-product check · same deal, 3 products live
Conventional
25% down · 7.5% · 30yr
- Down + closing
- —
- Monthly P&I
- —
- Monthly cashflow
- —
- DSCR
- —
- Eligible?
- —
Personal DTI + credit; lowest rate.
DSCR
20% down · 8.5% · 30yr
- Down + closing
- —
- Monthly P&I
- —
- Monthly cashflow
- —
- DSCR
- —
- Eligible?
- —
No personal income docs; deal must DSCR.
Hard money
10% down · 12.0% · 12mo
- Down + closing
- —
- Monthly P&I
- —
- Monthly cashflow
- —
- DSCR
- —
- Eligible?
- —
Short-term bridge; refi at stabilization.
Rent comps 40 comps
| Address | Beds | Baths | Sqft | Rent | $/sqft | DOM | Units | Dist |
|---|---|---|---|---|---|---|---|---|
| 623 Club Oak Dr River Oaks, TX | 3.0 | 2.0 | 1874 | $2,350 | $1.25 | 1d | 1 | 0.21mi |
| 636 Schieme St River Oaks, TX | 2.0 | 1.0 | 1515 | $1,545 | $1.02 | 45d | 1 | 0.25mi |
| 5549 Sam Calloway Rd Fort Worth, TX | 3.0 | 2.0 | 1555 | $2,500 | $1.61 | 21d | 1 | 0.29mi |
| 5332 Trinity River Trl Unit 2301 Fort Worth, TX | 2.0 | 2.0 | 1150 | $2,099 | $1.83 | 6d | 1 | 0.36mi |
| 5200 White Settlement Rd Fort Worth, TX | 1.0–2.0 | 1.0–2.0 | 963 | $1,985 | $2.06 | 0d | 18 | 0.38mi |
| 123 Merritt St Fort Worth, TX | 2.0 | 2.5 | 1200 | $2,550 | $2.12 | 1d | 5 | 0.44mi |
| 117 Priddy Ln Fort Worth, TX | 1.0–2.0 | 1.0–2.0 | 1009 | $1,899 | $1.88 | 3d | 6 | 0.49mi |
| 5601 N Schilder Dr River Oaks, TX | 3.0 | 1.0 | 1183 | $1,800 | $1.52 | 45d | 1 | 0.49mi |
| 5601 N Schilder Dr River Oaks, TX | 3.0 | 1.0 | 1183 | $1,800 | $1.52 | 26d | 1 | 0.49mi |
| 4921 White Settlement Rd Unit 4958 Fort Worth, TX | 2.0 | 2.0 | 1154 | $1,889 | $1.64 | 1d | 1 | 0.49mi |
| 6000 Calloway Ct Fort Worth, TX | 2.0 | 2.0 | 900 | $1,400 | $1.56 | 45d | 1 | 0.56mi |
| 6000 Calloway Ct Fort Worth, TX | 2.0 | 2.0 | 900 | $1,400 | $1.56 | 9d | 1 | 0.56mi |
| 216 Westfork Dr Fort Worth, TX | 2.0 | 1.0 | 1496 | $2,200 | $1.47 | 45d | 1 | 0.56mi |
| 920 Yale St River Oaks, TX | 3.0 | 2.0 | 1686 | $1,670 | $0.99 | 26d | 1 | 0.59mi |
| 228 Athenia Dr Fort Worth, TX | 3.0 | 1.0–2.0 | 1072 | $2,415 | $2.25 | 1d | 22 | 0.60mi |
| 5217 Deavers Ln Fort Worth, TX | 3.0 | 1.0 | 1081 | $1,695 | $1.57 | 45d | 1 | 0.61mi |
| 835 Stamps Ave Fort Worth, TX | 4.0 | 2.5 | 1703 | $2,200 | $1.29 | 24d | 1 | 0.63mi |
| 837 Stamps Ave Unit 835 Fort Worth, TX | 4.0 | 2.5 | 1703 | $2,200 | $1.29 | 1d | 1 | 0.64mi |
| 6038 Calloway Ct Fort Worth, TX | 2.0 | 1.5 | 900 | $1,475 | $1.64 | 45d | 1 | 0.65mi |
| 315 Athenia Dr Fort Worth, TX | 3.0 | 2.5 | 1581 | $2,750 | $1.74 | 4d | 1 | 0.70mi |
| 5605 Baylor Ave River Oaks, TX | 3.0 | 2.0 | 1800 | $2,200 | $1.22 | 46d | 1 | 0.79mi |
| 315 Isbell Rd Fort Worth, TX | 3.0 | 2.0 | 924 | $1,600 | $1.73 | 17d | 1 | 0.85mi |
| 315 Isbell Rd Fort Worth, TX | 3.0 | 2.0 | 924 | $1,600 | $1.73 | 1d | 1 | 0.85mi |
| 315 Isbell Rd Fort Worth, TX | 3.0 | 2.0 | 924 | $1,600 | $1.73 | 15d | 1 | 0.85mi |
| 772 Fernwood St Fort Worth, TX | 4.0 | 2.0 | 1513 | $2,400 | $1.59 | 26d | 1 | 0.88mi |
| 4925 Scott Rd Fort Worth, TX | 1.0–2.0 | 1.0–2.5 | 1226 | $3,776 | $3.08 | 0d | 14 | 0.91mi |
| 5128 Tulane Ave River Oaks, TX | 3.0 | 2.0 | 1482 | $1,895 | $1.28 | 6d | 1 | 0.93mi |
| 5836 Pollard Dr Westworth Village, TX | 3.0 | 1.0 | 1012 | $1,725 | $1.70 | 1d | 1 | 0.98mi |
| 6152 River Pointe Dr Fort Worth, TX | 4.0 | 2.5 | 1748 | $2,050 | $1.17 | 9d | 1 | 0.98mi |
| 5700 Dennis Ave Fort Worth, TX | 3.0 | 1.0 | 1036 | $1,700 | $1.64 | 17d | 1 | 1.02mi |
| 5832 Tracyne Dr Westworth Village, TX | 3.0 | 2.0 | 1450 | $2,400 | $1.66 | 26d | 1 | 1.05mi |
| 1310 Yale St River Oaks, TX | 3.0 | 2.0 | 1726 | $2,395 | $1.39 | 26d | 1 | 1.07mi |
| 1310 Yale St River Oaks, TX | 3.0 | 2.0 | 1726 | $2,395 | $1.39 | 1d | 1 | 1.07mi |
| 5825 Aton Ave Westworth Village, TX | 3.0 | 1.5 | 1133 | $1,945 | $1.72 | 1d | 1 | 1.09mi |
| 904 Isbell Rd Unit 202 Fort Worth, TX | 2.0 | 2.0 | 921 | $1,200 | $1.30 | 45d | 1 | 1.11mi |
| 904 Isbell Rd Unit 200 Fort Worth, TX | 2.0 | 2.0 | 921 | $1,175 | $1.28 | 7d | 1 | 1.11mi |
| 5860 Tracyne Dr Westworth Village, TX | 3.0 | 1.5 | 1408 | $1,999 | $1.42 | 0d | 1 | 1.11mi |
| 916 Isbell Rd Unit D Fort Worth, TX | 3.0 | 1.0 | 921 | $1,450 | $1.57 | 24d | 1 | 1.13mi |
| 1501 Greenbrier Dr Fort Worth, TX | 3.0 | 2.0 | 1332 | $1,900 | $1.43 | 5d | 1 | 1.21mi |
| 933 River Rd Fort Worth, TX | 3.0 | 2.5 | 1448 | $2,000 | $1.38 | 15d | 1 | 1.26mi |
Listing history 3 events
-
2026-05-18status Pending 772-char remark
-
2026-05-04$199,000 Active 772-char remark
-
2026-04-22soldstatus
ⓘ Source: listings_history table (triggers on properties + properties_extension) + one-shot
backfill from property_details.listing_events for pre-trigger history.
Tax reassessment forecast TX · Resets to sale price
- Current annual tax
- $5,211 · $434/mo
- Projected year-2 tax
- $5,211 · $434/mo
- Expected delta
- $0/yr ($0/mo · 0.0%)
ⓘ Screening estimate from a state-policy table — verify with the county assessor before closing.
Climate risk First Street
- Flood 1/10 Low FEMA zone X (unshaded) · 0% chance over 30 yrs
- Wildfire 3/10 Moderate
- Heat 7/10 Severe 7 d/yr ≥109°F today · 23 d/yr by 30 yrs out
- Wind 6/10 Major 27% chance of damaging wind over 30 yrs
- Air quality 3/10 Moderate 3 unhealthy d/yr today · 4 by 30 yrs out
Nearby sold comps map
Loading sold comps map…
Walkable amenities ~0.75 mi
Loading nearby amenities…
Taxation est. · year 1
- Rental income
- $24,294
- − Mortgage interest
- −$11,147
- − Property taxes
- −$5,211
- − Insurance
- −$995
- − Repairs & maintenance
- −$1,943
- − Management
- −$1,943
- − Depreciation
- −$5,789
- Taxable loss
- −$2,735
- Est. tax savings @ 24.0%
- +$657
- After-tax cash flow
- $1,120/yr
For passive investors: Depreciation is non-cash, so a rental often shows a tax loss while cash-flowing — sheltering income. Rental losses are passive: they offset passive income freely, and up to $25,000/yr can offset ordinary (W-2) income if you actively participate and your MAGI is under $100k (phasing out to $0 by $150k); unused losses carry forward. On sale, claimed depreciation is recaptured at up to 25%, and gains may owe capital-gains tax (a 1031 exchange can defer both). Figures are a year-1 estimate at your 24.0% rate — not tax advice; consult a CPA.
Schools (NCES district)
- District
- Castleberry ISD
- NCES district ID
- 4813170
- Math proficiency
- 21% ▼ -17.00%
- Reading proficiency
- 32% ▼ -5.00%
- Median HH income
- $39,060
- Composite
- 22.22/100
- National rank
- #8152
- State rank
- #701 of 826 in TX
Livability — River Oaks
- Score
- 72/100
- State rank
- #237
- US rank
- #5774
Category grades
Schools grade is shown separately in the Schools card above.
Census & demographics
- Census place
- River Oaks, TX
- County
- Tarrant County · 2,033,669 people
- City population
- 27,357
- Metro
- Dallas-Fort Worth-Arlington, TX
- Population (ZIP)
- 27,357
- Household income
- $62,073
- Rent vs Own
- Severe rent burden
- 1095.0
Population outlook (Tarrant County) Hauer SSP2
- Today (2025)
- 2,380,417 people
- By 2030
- 2,578,900 · +8.3%
- By 2040
- 2,974,995 · +25.0%
- By 2050
- 3,350,489 · +40.8%
- By 2075
- 4,216,909 · +77.2%
- By 2100
- 4,741,527 · +99.2%
Race, ethnicity, and origin ACS 2023
- Neighborhood character
- Majority Hispanic (61%)
- Race & ethnicity
- Hispanic / Latino 61% White 35% Two or more races 20% Native American 3% Black 2%
- Hispanic origin (detail)
- Mexican 56%
- Common ancestry
- Slovak 2% Italian 1% Serbian 1%
- Foreign-born
- 17% · Canada
- Languages at home
- 54% English-only · Spanish 45%
Political lean MEDSL · Tarrant
- 2024 margin
- Lean R (+5.1) · D 46.7% · R 51.9% · Other 1.4%
- 2008→2024 swing
- +6.6pp toward D · 2008: -11.7pp · 2024: -5.1pp
- All cycles
- 2024: R+5.1 2020: D+0.2 2016: R+8.7 2012: R+15.7 2008: R+11.7
Not yet ingested
- Civics
- —
Market trends
- HPI YoY
- ▼ -117.88%
- Current HPI
- 366.5263
- Rent YoY
- ▲ 1.88%
- Metro
- Dallas-Fort Worth-Arlington, TX
- State GDP YoY
- ▲ 3.95%
- F500 in state
- 110
Industry mix (Fortune 500 HQ in TX)
| Industry | F500 HQs | Revenue |
|---|---|---|
| Energy | 16 | $1,198B |
|
||
| Technology | 5 | $198B |
|
||
| Engineering / Construction | 4 | $72B |
|
||
| Energy Services | 3 | $60B |
|
||
| Utilities | 3 | $41B |
|
||
| Healthcare | 2 | $330B |
|
||
Price history
4 events — show timeline
- 2026-06-15 Sold (MLS) — NTREIS
- 2026-05-18 Pending — NTREIS
- 2026-05-04 Listed $199,000 NTREIS
- 2026-04-22 Sold (Public Records) — Public Records
Property tax history
+3.0%/yrLatest (2025): $5,211 · -10.0% YoY. Source: county tax records.
Cash-flow waterfall
monthlySold comps — $/sqft
last 12 mo · ≤1 miLoading sold comps…