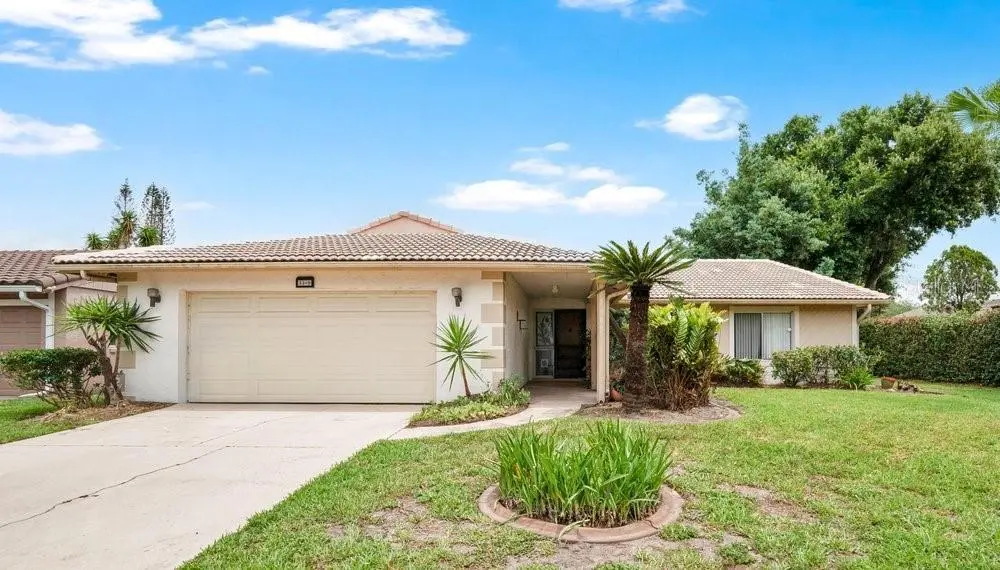
5309 Williamsport Dr
Williamsburg, FL 32821
$315,000C
3 bd · 2.0 ba ·
2,170 sqft ·
Built 1980
· SingleFamily
· Pending
· 5 DOM
Cashflow @ list (25.0% down · 7.5%)
Estimated rent
$2,759/mo
Mortgage (P&I)
−$1,652
Tax + insurance
−$295
HOA
−$80
Vac / Maint / Mgmt
−$579
Net cashflow
$153/mo
Annual
$1,834/yr
Cap rate
6.88%
Cash-on-cash
2.08%
DSCR
1.09
1% rule
0.88%
Cash to close
$88,200
Investor read
- This is a 3-bed/2.0-bath single-family listed at $315k.
- At list price, monthly cash flow is $153 ($2k/yr) — positive.
- The deal already cash-flows at list — no discount required.
- To meet the 1% rule (rent ≥ 1% of price), the offer needs to be $276k (12.4% below list).
- Only 5 days on market — expect competitive offers; lowballing is unlikely to land.
- Recommended offer: $276k (12.4% below list) — sets the bar for 1% rule.
- In year one you build about $3k of equity ($2k loan paydown + $935 appreciation (0.3% local appreciation)).
- Location reads 85/100 on livability (#29 in FL, #608 nationally) — a professional / high-income tenant draw. Strengths: housing A+, health & safety A+, crime A; Watch: amenities D.
- Orange (suburban): math 46% / reading 51% proficiency, ranked #43 of 73 in FL (top 59%) — families likely to look elsewhere, expect single-tenant / working-renter base with shorter leases.
- Zoned schools: Sunshine Elementary (math 41% / reading 43%, grade F, #1,403 of 2,144 statewide, top 67%, 949 students, 41% FRL); Freedom Middle (math 43% / reading 43%, grade D-, #331 of 571 statewide, top 59%, 1,159 students, 44% FRL); Lake Buena Vista High School (1,714 students, 49% FRL).
- Market conditions: Rents falling (-3.2%/yr); 281 active listings in the ZIP; 15 comparable units currently listed for rent nearby; rentals at typical pace (median 17d on market — plan ~3-4 weeks tenant-placement turnaround); 8,053 units permitted in Orange County in 2024 (3,133 in 5+ unit buildings).
- Orange County population projected at +52% by 2050 — long-run rental-demand tailwind backs the buy-and-hold thesis.
- By year 9, paydown + projected appreciation supports a ~$33k cash-out refi (75% LTV) — recoverable capital for the next deal without selling this one.
- Climate carrying-cost: severe wind risk, 99% chance of damaging wind over 30y; extreme-heat days projected 7→23/yr by 2055 (HVAC capex compounding) — expect insurance premiums to compound above CPI over the hold.
- Cap rate 6.9% vs local median 3.5% in Williamsburg — top-decile yield for the area; either an underpriced asset or a hidden risk that comps aren't pricing in. Stress-test before assuming the spread holds.
- At $2,759/mo this rent would consume 48% of the median local household income ($69k/yr) (locally 1840% of renters already pay >50% of income on rent) — very limited rent-growth headroom before tenants either downsize or default.
Questions for listing agent
- What does the HOA fee cover, when was the last increase, and are there any pending special assessments or reserve-fund shortfalls?
- Is there a deadline driving the sale (1031 exchange, divorce, estate, relocation)? That informs how much negotiation room exists.
- Schools are F-rated, which usually means shorter tenancies and higher turnover. Who's the typical renter profile here, and what's been the actual vacancy rate?
- What's the average days-on-market for RENTAL listings here right now (not sales)? A rising rental-DOM trend means longer vacancies and softer asking-rent achievability than the comps imply.
- What's the recent tenant-quality profile in this submarket — average credit score on applications, eviction rate, late-payment / NSF rate, and stable-employment percentage? A property-management company in the area should have these aggregated.
- How much new for-sale + rental construction is in the pipeline within 1–3 miles? Heavy new supply typically softens prices + rents 12–24 months out; constrained supply supports both.
CashFlowRE · CFR-WMF8XE59014NF1
· Data 4 days ago
cashflowre.app · 2026-05-29