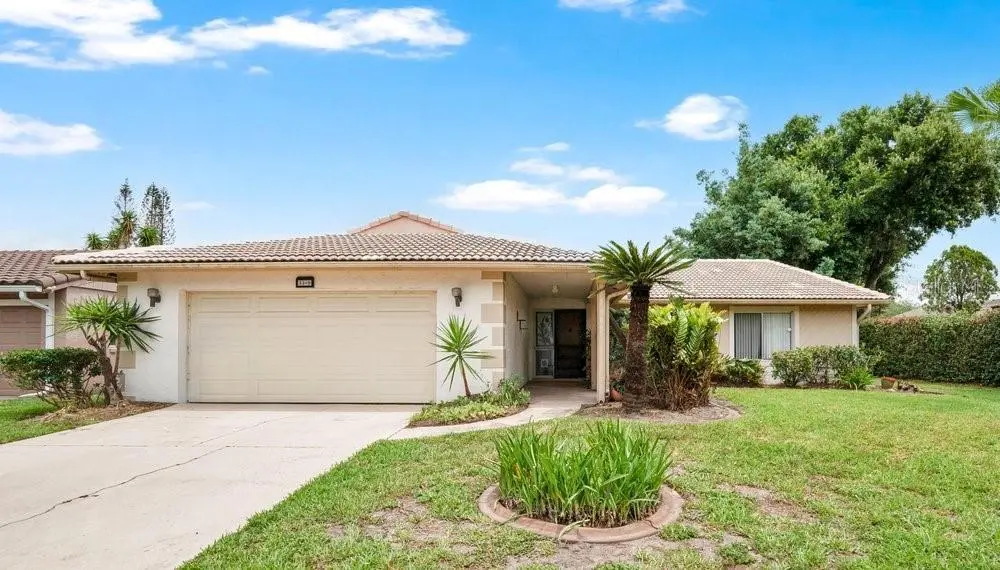
5309 Williamsport Dr · Williamsburg, FL
Flood risk 1/10 · Minimal
- FEMA flood zone
- X (unshaded)
- Chance of flooding over 30 yrs
- 0.0%
- Est. flood insurance / yr
- $507 – $1,088
Fire risk 4/10 · Minor
- Est. fire insurance / yr
- $947 – $1,759
Heat risk 9/10 · Severe
- Hot days now (above 108°F)
- 7 days/yr
- Hot days in 30 yrs
- 23 days/yr
Wind risk 9/10 · Severe
- Chance of severe wind over 30 yrs
- 99.0%
Air-quality risk 1/10 · Minimal
- Unhealthy air days now
- 0 days/yr
- Unhealthy air days in 30 yrs
- 0 days/yr
Risk factors via First Street. Map © Google.
Why this score? — see what drove the C grade
The composite is a weighted blend of 9 inputs, each scored 0–100. Each bar is that input's sub-score; the figure is the points it added to the 100-point composite (weight × sub-score).
- Cash flow +16.0/30.0
- ARV discount +15.0/15.0
- Appreciation +5.1/10.0
- DSCR +5.0/10.0
- Livability +4.2/5.0
- Schools +4.1/10.0
- 1% rule +3.8/10.0
- Condition / age +2.5/5.0
- Rent growth +1.7/5.0
$315,000
🖨 Deal sheet (PDF) 📄 Offer letter ✓ Due diligence
Listing remarks
MULTIPLE OFFERS -PLEASE PRESENT HIGHEST AND BEST. Welcome to this beautifully maintained 3-bedroom, 2-bathroom home nestled on a quiet street in the highly sought-after Williamsburg community of Orlando. Known for its pride of ownership and strong sense of community, Williamsburg offers a peaceful, owner-occupied environment where leasing is prohibited, creating a stable and tranquil neighborhood atmosphere. Step inside to a welcoming foyer that opens to a bright and spacious floor plan designed for both everyday living and entertaining. The home features a generous living room, a separate family room, and a dining area conveniently located adjacent to the kitchen, creating the perfect gath
Key facts
- 6,699 sq ft lot
- 2 garage spots
- Built 1980
Property features AI
Finance
- Other: Homestead exempt; Unfurnished; Living area reported as approximately 2,081 sq ft (building area 2,200 sq ft)
- HOA & community: No association indicated
Exterior
- Parking: Attached garage with 2 spaces; Garage door opener
- Utilities: Public water; Public sewer; Cable available
- Home design: Single-family residence; One story; North-facing entry; Residential, completed condition; Zoned P-D
- Construction: Block construction; Tile roof; Slab foundation; Built on lot under 1/4 acre (approximately 0.15 acre)
- Exterior features: Patio; Rear porch; Exterior lighting; Sidewalk
Interior
- Kitchen: Range; Refrigerator
- Bedrooms: 3 bedrooms
- Flooring: Ceramic tile; Other basement (finished/unfinished not specified)
- Bathrooms: 2 full bathrooms
- Heating & cooling: Central heating; Central air conditioning
- Interior features: Eat-in kitchen; Sliding doors; Interior lighting; Patio and rear porch access
- Laundry & utility: Laundry located in garage
Neighborhood map
What this means for you Summary
Snapshot
- This is a 3-bed/2.0-bath single-family listed at $315k.
Deal economics
- At list price, monthly cash flow is $158 ($2k/yr) — positive.
- The deal already cash-flows at list — no discount required.
- To meet the 1% rule (rent ≥ 1% of price), the offer needs to be $277k (12.2% below list).
- Recommended offer: $277k (12.2% below list) — sets the bar for 1% rule.
- Cap rate 6.9% vs local median 3.6% in Williamsburg — top-decile yield for the area; either an underpriced asset or a hidden risk that comps aren't pricing in. Stress-test before assuming the spread holds.
Location & tenants
- Location reads 85/100 on livability (#29 in FL, #608 nationally) — a professional / high-income tenant draw. Strengths: housing A+, health & safety A+, crime A; Watch: amenities D.
- Orange (suburban): math 46% / reading 51% proficiency, ranked #43 of 73 in FL (top 59%) — families likely to look elsewhere, expect single-tenant / working-renter base with shorter leases.
- Zoned schools: Sunshine Elementary (math 41% / reading 43%, grade F, #1,403 of 2,144 statewide, top 67%, 949 students, 41% FRL); Freedom Middle (math 43% / reading 43%, grade D-, #331 of 571 statewide, top 59%, 1,159 students, 44% FRL); Lake Buena Vista High School (1,714 students, 49% FRL).
- Market conditions: Rents falling (-3.2%/yr); 281 active listings in the ZIP; 15 comparable units currently listed for rent nearby; rentals at typical pace (median 16d on market — plan ~3-4 weeks tenant-placement turnaround); 8,053 units permitted in Orange County in 2024 (3,133 in 5+ unit buildings).
- At $2,765/mo this rent would consume 48% of the median local household income ($69k/yr) (locally 1840% of renters already pay >50% of income on rent) — very limited rent-growth headroom before tenants either downsize or default.
Forward outlook
- In year one you build about $3k of equity ($2k loan paydown + $935 appreciation (0.3% local appreciation)).
- Orange County population projected at +52% by 2050 — long-run rental-demand tailwind backs the buy-and-hold thesis.
- By year 9, paydown + projected appreciation supports a ~$33k cash-out refi (75% LTV) — recoverable capital for the next deal without selling this one.
Negotiation context
- Only 5 days on market — expect competitive offers; lowballing is unlikely to land.
Risks & watch-outs
- Climate carrying-cost: severe wind risk, 99% chance of damaging wind over 30y; extreme-heat days projected 7→23/yr by 2055 (HVAC capex compounding) — expect insurance premiums to compound above CPI over the hold.
Questions for the listing agent
- What does the HOA fee cover, when was the last increase, and are there any pending special assessments or reserve-fund shortfalls?
- Is there a deadline driving the sale (1031 exchange, divorce, estate, relocation)? That informs how much negotiation room exists.
- Schools are F-rated, which usually means shorter tenancies and higher turnover. Who's the typical renter profile here, and what's been the actual vacancy rate?
- What's the average days-on-market for RENTAL listings here right now (not sales)? A rising rental-DOM trend means longer vacancies and softer asking-rent achievability than the comps imply.
- What's the recent tenant-quality profile in this submarket — average credit score on applications, eviction rate, late-payment / NSF rate, and stable-employment percentage? A property-management company in the area should have these aggregated.
- How much new for-sale + rental construction is in the pipeline within 1–3 miles? Heavy new supply typically softens prices + rents 12–24 months out; constrained supply supports both.
Investment metrics
- 1% rule
- 0.88% ✗
- Cap rate
- 6.89%
- Cash-on-cash
- 2.15%
- DSCR
- 1.10
- GRM
- 9.5
CMA / ARV
- ARV (on-the-fly)
- $394,940
- Comps found
- 7
Show comp detail 7 sales within ~0.75 mi
| Address | Dist | Beds/Ba | Sqft | Sold | Price | $/sf | Match |
|---|---|---|---|---|---|---|---|
| 10807 Wheaton Ct | 0.05mi | 3/2.0 | 1,873 (-14%) | 22mo | $330,000 | $176 | 56 |
| 10735 Leafy Laurel | 0.47mi | 3/2.5 | 1,896 (-13%) | 2mo | $529,990 | $280 | 53 |
| 4930 Gifford Blvd | 0.75mi | 3/2.0 | 1,988 (-8%) | 1mo | $360,000 | $181 | 51 |
| 10106 Donhill Ct | 0.67mi | 2/2.0 (-1) | 2,040 (-6%) | 9mo | $372,000 | $182 | 47 |
| 5520 Wildflower Rd | 0.37mi | 3/2.0 | 1,873 (-14%) | 24mo | $340,000 | $182 | 40 |
| 5003 Gardengate Ln | 0.67mi | 3/2.0 | 1,873 (-14%) | 9mo | $315,000 | $168 | 39 |
| 5518 Memorial Dr | 0.64mi | 3/2.0 | 1,873 (-14%) | 22mo | $398,925 | $213 | 29 |
Match score weights: distance 35% · size 25% · config 20% · recency 20%. Top-matched comps best support the ARV.
Projected returns pro-forma
0.3% appreciation · 0.0% rent growth · sell at horizon
- IRR
- -0.7%
- Equity multiple
- 0.97×
- Total profit
- $-2,885
- Equity at exit
- $96,169
- IRR
- 2.7%
- Equity multiple
- 1.29×
- Total profit
- $25,303
- Equity at exit
- $119,422
Cash invested: $88,200 (down + closing). Projections, not guarantees.
Landlord ↔ Tenant lean methodology
- Overall (STATE)
- 87 Strongly Landlord-Friendly
- State Florida
- 87 Strongly Landlord-Friendly · R+3
- County
- — inherits STATE
- City
- — inherits STATE
ZIP-level market 32821
- Home prices YoY
- 0.1%
- Rents YoY
- -3.2%
- Active inventory
- 281
- Price-to-rent
- 9.5×
Monthly cashflow live
- Estimated rent
- $2,765 high interval (Pro) →
- Mortgage (P&I)
- −$1,652
- Tax from tax record
- −$164 /mo · $1,962/yr
- Insurance
- −$131
- HOA
- −$80
- Vacancy / Maint / Mgmt
- −$581
- Net cashflow
- $158
Break-even live
Sensitivity live
| Price | -10% $336 | -5% $247 | +0% $158 | +5% $69 | +10% $-20 |
|---|---|---|---|---|---|
| Rent | -10% $-60 | -5% $49 | +0% $158 | +5% $267 | +10% $376 |
| Rate | -1.0pp $317 | -0.5pp $238 | base $158 | +0.5pp $76 | +1.0pp $-7 |
UW: 25.0% down · 7.5% · 30yr · 1.5% tax · 5.0% vac · 8.0% maint · 8.0% mgmt
Financing live
Cash to close
- Down payment
- $78,750
- Closing costs
- $9,450
- Reserves months
- —
- Total cash needed
- —
Loan-product check · same deal, 3 products live
Conventional
25% down · 7.5% · 30yr
- Down + closing
- —
- Monthly P&I
- —
- Monthly cashflow
- —
- DSCR
- —
- Eligible?
- —
Personal DTI + credit; lowest rate.
DSCR
20% down · 8.5% · 30yr
- Down + closing
- —
- Monthly P&I
- —
- Monthly cashflow
- —
- DSCR
- —
- Eligible?
- —
No personal income docs; deal must DSCR.
Hard money
10% down · 12.0% · 12mo
- Down + closing
- —
- Monthly P&I
- —
- Monthly cashflow
- —
- DSCR
- —
- Eligible?
- —
Short-term bridge; refi at stabilization.
Rent comps 15 comps
| Address | Beds | Baths | Sqft | Rent | $/sqft | DOM | Units | Dist |
|---|---|---|---|---|---|---|---|---|
| 5523 Westbrook Dr Orlando, FL | 3.0 | 2.0 | 1589 | $2,150 | $1.35 | 25d | 1 | 0.24mi |
| 5033 Loyola Ln Orlando, FL | 3.0 | 2.0 | 1873 | $2,350 | $1.25 | 23d | 1 | 0.40mi |
| 5673 Parkview Lake Dr Orlando, FL | 3.0 | 2.0 | 1708 | $2,850 | $1.67 | 9d | 1 | 0.41mi |
| 10502 Linger Ln Orlando, FL | 3.0 | 2.0 | 2136 | $2,600 | $1.22 | 25d | 1 | 0.46mi |
| 5730 Parkview Lake Dr Orlando, FL | 3.0 | 2.0 | 1946 | $3,300 | $1.70 | 23d | 1 | 0.54mi |
| 4905 Goucher Ln Orlando, FL | 3.0 | 2.0 | 1576 | $2,600 | $1.65 | 23d | 1 | 0.77mi |
| 6000 Paradiso Grande Blvd Orlando, FL | 1.0–3.0 | 1.0–2.0 | 1305 | $3,674 | $2.82 | 9d | 21 | 1.05mi |
| 4126 Breakview Dr #30401 Orlando, FL | 3.0 | 2.0 | 1447 | $2,600 | $1.80 | 25d | 1 | 1.10mi |
| 4804 Cayview Ave Unit 407 Orlando, FL | 3.0 | 2.0 | 2097 | $2,450 | $1.17 | 16d | 1 | 1.22mi |
| 5024 Shoreway Loop Unit 1244708P Orlando, FL | 3.0 | 2.0 | 1991 | $4,876 | $2.45 | 9d | 1 | 1.28mi |
| 5048 Shoreway Loop Unit 1244718P Orlando, FL | 3.0 | 2.0 | 1991 | $4,705 | $2.36 | 3d | 1 | 1.29mi |
| 10107 Ancora Cir Orlando, FL | 1.0–3.0 | 1.0–2.0 | 1091 | $2,452 | $2.25 | 4d | 23 | 1.32mi |
| 4801 Tidecrest Ave Orlando, FL | 3.0 | 3.5 | 1600 | $2,050 | $1.28 | 5d | 1 | 1.32mi |
| 5037 Shoreway Loop Unit 1244717P Orlando, FL | 3.0 | 2.0 | 1991 | $5,126 | $2.57 | 9d | 1 | 1.34mi |
| 8000 Cool Breeze Dr #105 Orlando, FL | 3.0 | 3.5 | 1746 | $2,399 | $1.37 | 25d | 1 | 1.40mi |
HOA detail
- Monthly dues
- $80 · $960/yr
Listing history 7 events
-
2026-06-18status $315,000 Pending 5 DOM
-
2026-06-18days on market $315,000 Active 5 DOM
-
2026-06-17days on market $315,000 Active 4 DOM
-
2026-06-16days on market $315,000 Active 3 DOM
-
2026-06-15days on market $315,000 Active 2 DOM
-
2026-06-13remarks 699-char remark
-
2026-06-13$315,000 Active 1 DOM
ⓘ Source: listings_history table (triggers on properties + properties_extension) + one-shot
backfill from property_details.listing_events for pre-trigger history.
Tax reassessment forecast FL · Resets to sale price
- Current annual tax
- $1,962 · $164/mo
- Projected year-2 tax
- $2,614 · $218/mo
- Expected delta
- +$652/yr (+$54/mo · 33.2%)
ⓘ Screening estimate from a state-policy table — verify with the county assessor before closing.
Climate risk First Street
- Flood 1/10 Low FEMA zone X (unshaded) · 0% chance over 30 yrs
- Wildfire 4/10 Moderate
- Heat 9/10 Extreme 7 d/yr ≥108°F today · 23 d/yr by 30 yrs out
- Wind 9/10 Extreme 99% chance of damaging wind over 30 yrs
- Air quality 1/10 Low 0 unhealthy d/yr today · 0 by 30 yrs out
Nearby sold comps map
Loading sold comps map…
Walkable amenities ~0.75 mi
Loading nearby amenities…
Taxation est. · year 1
- Rental income
- $33,185
- − Mortgage interest
- −$17,645
- − Property taxes
- −$1,962
- − Insurance
- −$1,575
- − Repairs & maintenance
- −$2,655
- − Management
- −$2,655
- − HOA
- −$960
- − Depreciation
- −$9,164
- Taxable loss
- −$3,430
- Est. tax savings @ 24.0%
- +$823
- After-tax cash flow
- $2,719/yr
For passive investors: Depreciation is non-cash, so a rental often shows a tax loss while cash-flowing — sheltering income. Rental losses are passive: they offset passive income freely, and up to $25,000/yr can offset ordinary (W-2) income if you actively participate and your MAGI is under $100k (phasing out to $0 by $150k); unused losses carry forward. On sale, claimed depreciation is recaptured at up to 25%, and gains may owe capital-gains tax (a 1031 exchange can defer both). Figures are a year-1 estimate at your 24.0% rate — not tax advice; consult a CPA.
Schools (NCES district)
- District
- Orange
- NCES district ID
- 1201440
- Math proficiency
- 46% ▼ -9.00%
- Reading proficiency
- 51% ▼ -2.00%
- Median HH income
- $49,350
- Composite
- 41.47/100
- National rank
- #3461
- State rank
- #43 of 73 in FL
Livability — Williamsburg
- Score
- 85/100
- State rank
- #29
- US rank
- #608
Category grades
Schools grade is shown separately in the Schools card above.
Census & demographics
- Census place
- Williamsburg, FL
- County
- Orange County · 1,471,359 people
- Metro
- Orlando-Kissimmee-Sanford, FL
- Population (ZIP)
- 26,161
- Household income
- $69,348
- Rent vs Own
- Severe rent burden
- 1840.0
Population outlook (Orange County) Hauer SSP2
- Today (2025)
- 1,618,226 people
- By 2030
- 1,787,404 · +10.5%
- By 2040
- 2,125,621 · +31.4%
- By 2050
- 2,454,016 · +51.6%
- By 2075
- 3,173,711 · +96.1%
- By 2100
- 3,607,781 · +122.9%
Race, ethnicity, and origin ACS 2023
- Neighborhood character
- Diverse neighborhood (Simpson 0.65)
- Race & ethnicity
- White 43% Hispanic / Latino 41% Two or more races 19% Black 6% Asian 3% Pacific Islander 1% Native American 1%
- Hispanic origin (detail)
- Mexican 3% Puerto Rican 11% Cuban 1% Dominican 4%
- Common ancestry
- Romanian 3% Lithuanian 2% Estonian 2%
- Foreign-born
- 29% · Canada, Jamaica, China
- Languages at home
- 58% English-only · Spanish 32% Other Indo-European 4% Other Asian/Pacific 2%
Political lean MEDSL · Orange
- 2024 margin
- D (+13.6) · D 56.1% · R 42.5% · Other 1.3%
- 2008→2024 swing
- -5.0pp toward R · 2008: 18.6pp · 2024: 13.6pp
- All cycles
- 2024: D+13.6 2020: D+23.1 2016: D+24.6 2012: D+18.2 2008: D+18.6
Not yet ingested
- Civics
- —
Market trends
- HPI YoY
- ▲ 0.30%
- Current HPI
- 300.2268
- Rent YoY
- ▼ -3.20%
- Metro
- Orlando-Kissimmee-Sanford, FL
- State GDP YoY
- ▲ 3.28%
- F500 in state
- 36
Industry mix (Fortune 500 HQ in FL)
| Industry | F500 HQs | Revenue |
|---|---|---|
| Industrial Technology | 2 | $29B |
|
||
| Insurance | 2 | $17B |
|
||
| Retail | 1 | $60B |
|
||
| Technology Distribution | 1 | $58B |
|
||
| Homebuilding | 1 | $35B |
|
||
| Technology Manufacturing | 1 | $35B |
|
||
Price history
1 event — show timeline
- 2026-06-13 Listed $315,000 Stellar MLS as Distributed by MLS Grid
Property tax history
+2.3%/yrLatest (2025): $1,962 · +8.9% YoY. Source: county tax records.
Cash-flow waterfall
monthlySold comps — $/sqft
last 12 mo · ≤1 miLoading sold comps…