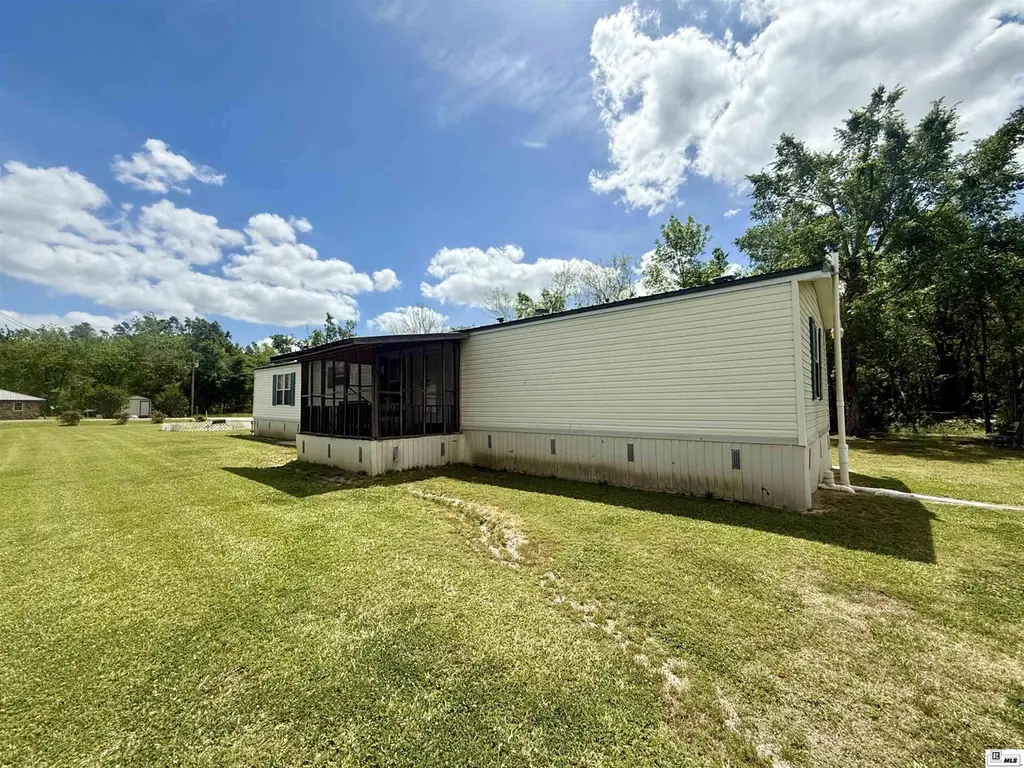
10560 E Cotton Rd
Oak Ridge, LA 71264
$97,500C+
3 bd · 2.0 ba ·
1,184 sqft ·
Built —
· Manufactured
· Pending
· 51 DOM
Cashflow @ list (25.0% down · 7.5%)
Estimated rent
$1,002/mo
Mortgage (P&I)
−$511
Tax + insurance
−$65
HOA
−$0
Vac / Maint / Mgmt
−$210
Net cashflow
$216/mo
Annual
$2,587/yr
Cap rate
8.95%
Cash-on-cash
9.48%
DSCR
1.42
1% rule
1.03%
Cash to close
$27,300
Investor read
- This is a 3-bed/2.0-bath manufactured listed at $98k.
- At list price, monthly cash flow is $216 ($3k/yr) — positive.
- The deal already cash-flows at list — no discount required.
- Meets the 1% rule at list price ($1k rent vs $98k).
- It's been on market 51 days — a 3% lower offer ($95k) is reasonable based on typical stale-listing flexibility.
- Recommended offer: $95k (3.0% below list) — sets the bar for market timing.
- In year one you build about $3k of equity ($674 loan paydown + $3k appreciation (2.9% local appreciation)).
- Location reads 55/100 on livability (#359 in LA) — a working-class tenant base; expect higher turnover. Strengths: cost of living A+, crime A; Watch: health & safety D, amenities F, commute F.
- Morehouse Parish (town): math 10% / reading 19% proficiency, ranked #83 of 98 in LA (top 85%) — low school quality limits family demand, transient renter base, plan for 1-2y turnover; 78% free/reduced lunch — lower-income household profile, screen leases tightly.
- Zoned schools: Morehouse Elementary School (math 3% / reading 9%, grade F, #630 of 646 statewide, top 98%, 587 students, 6% FRL); Bastrop High School (math 3% / reading 7%, grade F, #260 of 265 statewide, top 100%, 902 students, 6% FRL) — zoned schools average 6% FRL vs 78% district-wide (72 pts lower); this property's tenant base skews higher-income than the district average.
- Market conditions: 9 active listings in the ZIP; 11 units permitted in Morehouse Parish in 2024 (0 in 5+ unit buildings).
- Morehouse County population projected at -29% by 2050 — secular population decline; favor cash flow + early exit over multi-decade hold.
- 2 sale attempts with the ask held roughly flat each time — persistent listings suggest the price (not the market) is what's stuck; bring a comps-based counter.
- At projected returns (2.9% appreciation + 3.0% rent growth), your $27k cash investment doubles in ~5 years — after that, you're playing with house money.
- By year 10, paydown + projected appreciation supports a ~$34k cash-out refi (75% LTV) — recoverable capital for the next deal without selling this one.
- Climate carrying-cost: severe wind risk, 80% chance of damaging wind over 30y; extreme-heat days projected 7→20/yr by 2055 (HVAC capex compounding) — expect insurance premiums to compound above CPI over the hold.
Questions for listing agent
- It's been on market 51 days. Have you received any prior offers? Is the seller open to a 3% concession, seller financing, or rate buy-down credit?
- Is there a deadline driving the sale (1031 exchange, divorce, estate, relocation)? That informs how much negotiation room exists.
- What's the average days-on-market for RENTAL listings here right now (not sales)? A rising rental-DOM trend means longer vacancies and softer asking-rent achievability than the comps imply.
- What's the recent tenant-quality profile in this submarket — average credit score on applications, eviction rate, late-payment / NSF rate, and stable-employment percentage? A property-management company in the area should have these aggregated.
- How much new for-sale + rental construction is in the pipeline within 1–3 miles? Heavy new supply typically softens prices + rents 12–24 months out; constrained supply supports both.
CashFlowRE · CFR-WMQGR4B2Z26YY4
· Data 6 days ago
cashflowre.app · 2026-05-29