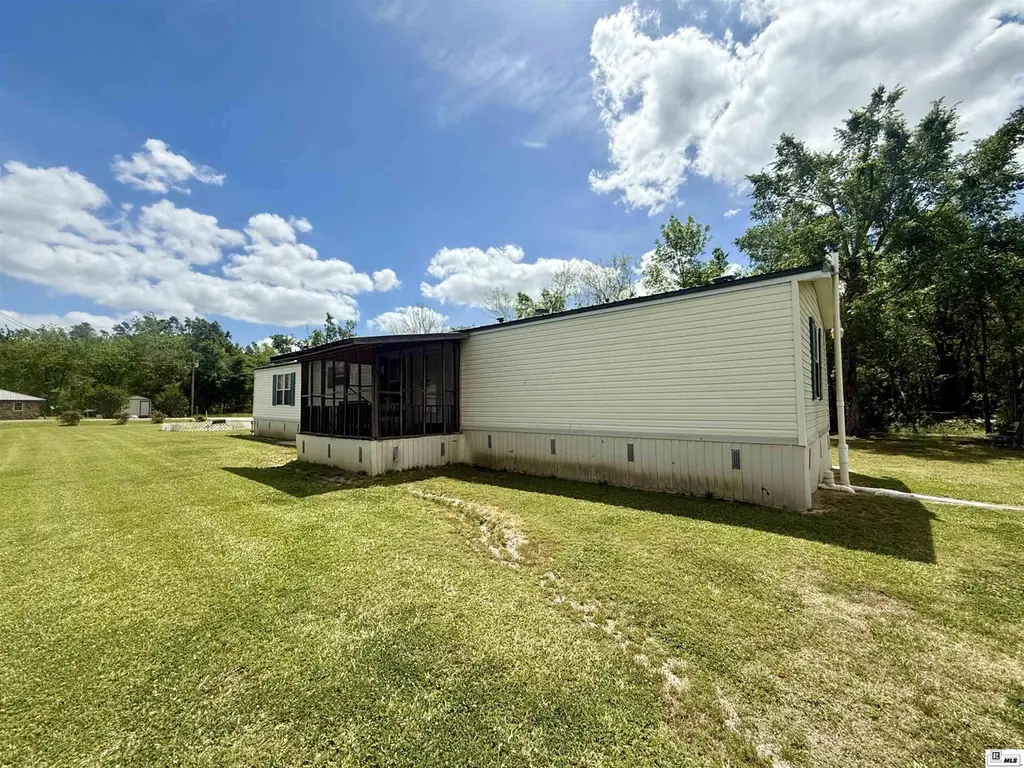
10560 E Cotton Rd · Oak Ridge, LA
Flood risk 1/10 · Minimal
- FEMA flood zone
- X
- Chance of flooding over 30 yrs
- 0.0%
- Est. flood insurance / yr
- $507 – $1,088
Fire risk 1/10 · Minimal
- Est. fire insurance / yr
- $1,269 – $2,357
Heat risk 8/10 · Major
- Hot days now (above 110°F)
- 7 days/yr
- Hot days in 30 yrs
- 20 days/yr
Wind risk 8/10 · Major
- Chance of severe wind over 30 yrs
- 80.0%
Air-quality risk 1/10 · Minimal
- Unhealthy air days now
- 0 days/yr
- Unhealthy air days in 30 yrs
- 0 days/yr
Risk factors via First Street. Map © Google.
Why this score? — see what drove the C+ grade
The composite is a weighted blend of 9 inputs, each scored 0–100. Each bar is that input's sub-score; the figure is the points it added to the 100-point composite (weight × sub-score).
- Cash flow +25.1/30.0
- DSCR +8.2/10.0
- ARV discount +7.5/15.0
- Appreciation +6.4/10.0
- 1% rule +5.3/10.0
- Livability +2.8/5.0
- Rent growth +2.5/5.0
- Condition / age +2.5/5.0
- Schools +1.1/10.0
$97,500
🖨 Deal sheet (PDF) 📄 Offer letter ✓ Due diligence
Listing remarks
Looking to have a nice country home and not break the bank! They look no further than 10560 E. Cotton Road. Oak Ridge, LA. Located approximately 19 miles from Meta! Nice 3 bed 2 bath Mobile Home on a nice 1 Acres Priced at only $97,500! The money has been spent here! With a nice concrete driveway leading up to the house with a nice two car carport. Step up onto the back porch, which is perfect for sitting out on relaxing and enjoying the day. Step up inside. Inside is nice and open with a Island bar in the center and a large open kitchen area and living room! Two nice size bedrooms on one end and bathroom, with a nice size master bedroom and large master bathroom. This property has a porch
Key facts
- Large open kitchen
- Concrete driveway
- Two car carport
Tags
Property features AI
Finance
- HOA & community: No association amenities
Exterior
- Parking: 2-car garage
- Utilities: Public water; Septic tank; Natural gas not available
- Home design: Single-wide mobile home; One story; Entry level: 1
- Construction: Vinyl siding; Metal roof; Other foundation
- Exterior features: Covered patio/porch; Irregular lot
Interior
- Kitchen: Dishwasher; Electric range
- Bedrooms: 3 main-level bedrooms
- Bathrooms: 2 full bathrooms
- Heating & cooling: Central electric heating; Central air conditioning; Ceiling fans
- Interior features: Ceiling fan(s)
- Laundry & utility: Electric water heater
Neighborhood map
What this means for you Summary
Snapshot
- This is a 3-bed/2.0-bath manufactured listed at $98k.
Deal economics
- At list price, monthly cash flow is $216 ($3k/yr) — positive.
- The deal already cash-flows at list — no discount required.
- Meets the 1% rule at list price ($1k rent vs $98k).
- Recommended offer: $95k (3.0% below list) — sets the bar for market timing.
Location & tenants
- Location reads 55/100 on livability (#359 in LA) — a working-class tenant base; expect higher turnover. Strengths: cost of living A+, crime A; Watch: health & safety D, amenities F, commute F.
- Morehouse Parish (town): math 10% / reading 19% proficiency, ranked #83 of 98 in LA (top 85%) — low school quality limits family demand, transient renter base, plan for 1-2y turnover; 78% free/reduced lunch — lower-income household profile, screen leases tightly.
- Zoned schools: Morehouse Elementary School (math 3% / reading 9%, grade F, #630 of 646 statewide, top 98%, 587 students, 6% FRL); Bastrop High School (math 3% / reading 7%, grade F, #260 of 265 statewide, top 100%, 902 students, 6% FRL) — zoned schools average 6% FRL vs 78% district-wide (72 pts lower); this property's tenant base skews higher-income than the district average.
- Market conditions: 9 active listings in the ZIP; 11 units permitted in Morehouse Parish in 2024 (0 in 5+ unit buildings).
Forward outlook
- In year one you build about $3k of equity ($674 loan paydown + $3k appreciation (2.9% local appreciation)).
- Morehouse County population projected at -29% by 2050 — secular population decline; favor cash flow + early exit over multi-decade hold.
- At projected returns (2.9% appreciation + 3.0% rent growth), your $27k cash investment doubles in ~5 years — after that, you're playing with house money.
- By year 10, paydown + projected appreciation supports a ~$34k cash-out refi (75% LTV) — recoverable capital for the next deal without selling this one.
Negotiation context
- It's been on market 51 days — a 3% lower offer ($95k) is reasonable based on typical stale-listing flexibility.
- 2 sale attempts with the ask held roughly flat each time — persistent listings suggest the price (not the market) is what's stuck; bring a comps-based counter.
Risks & watch-outs
- Climate carrying-cost: severe wind risk, 80% chance of damaging wind over 30y; extreme-heat days projected 7→20/yr by 2055 (HVAC capex compounding) — expect insurance premiums to compound above CPI over the hold.
Questions for the listing agent
- It's been on market 51 days. Have you received any prior offers? Is the seller open to a 3% concession, seller financing, or rate buy-down credit?
- Is there a deadline driving the sale (1031 exchange, divorce, estate, relocation)? That informs how much negotiation room exists.
- What's the average days-on-market for RENTAL listings here right now (not sales)? A rising rental-DOM trend means longer vacancies and softer asking-rent achievability than the comps imply.
- What's the recent tenant-quality profile in this submarket — average credit score on applications, eviction rate, late-payment / NSF rate, and stable-employment percentage? A property-management company in the area should have these aggregated.
- How much new for-sale + rental construction is in the pipeline within 1–3 miles? Heavy new supply typically softens prices + rents 12–24 months out; constrained supply supports both.
Investment metrics
- 1% rule
- 1.03% ✓
- Cap rate
- 8.95%
- Cash-on-cash
- 9.48%
- DSCR
- 1.42
- GRM
- 8.1
CMA / ARV
No comps found within radius.
Projected returns pro-forma
2.88% appreciation · 3.0% rent growth · sell at horizon
- IRR
- 16.0%
- Equity multiple
- 1.91×
- Total profit
- $24,796
- Equity at exit
- $43,166
- IRR
- 17.7%
- Equity multiple
- 3.56×
- Total profit
- $69,774
- Equity at exit
- $66,004
Cash invested: $27,300 (down + closing). Projections, not guarantees.
Landlord ↔ Tenant lean methodology
- Overall (STATE)
- 90 Strongly Landlord-Friendly
- State Louisiana
- 90 Strongly Landlord-Friendly · R+12
- County
- — inherits STATE
- City
- — inherits STATE
ZIP-level market 71264
- Home prices YoY
- 2.2%
- Active inventory
- 9
- Price-to-rent
- 8.1×
Monthly cashflow live
- Estimated rent
- $1,002 medium interval (Pro) →
- Mortgage (P&I)
- −$511
- Tax from tax record
- −$24 /mo · $287/yr
- Insurance
- −$41
- HOA
- −$0
- Vacancy / Maint / Mgmt
- −$210
- Net cashflow
- $216
Break-even live
Sensitivity live
| Price | -10% $271 | -5% $243 | +0% $216 | +5% $188 | +10% $160 |
|---|---|---|---|---|---|
| Rent | -10% $136 | -5% $176 | +0% $216 | +5% $255 | +10% $295 |
| Rate | -1.0pp $265 | -0.5pp $240 | base $216 | +0.5pp $190 | +1.0pp $165 |
UW: 25.0% down · 7.5% · 30yr · 1.5% tax · 5.0% vac · 8.0% maint · 8.0% mgmt
Financing live
Cash to close
- Down payment
- $24,375
- Closing costs
- $2,925
- Reserves months
- —
- Total cash needed
- —
Loan-product check · same deal, 3 products live
Conventional
25% down · 7.5% · 30yr
- Down + closing
- —
- Monthly P&I
- —
- Monthly cashflow
- —
- DSCR
- —
- Eligible?
- —
Personal DTI + credit; lowest rate.
DSCR
20% down · 8.5% · 30yr
- Down + closing
- —
- Monthly P&I
- —
- Monthly cashflow
- —
- DSCR
- —
- Eligible?
- —
No personal income docs; deal must DSCR.
Hard money
10% down · 12.0% · 12mo
- Down + closing
- —
- Monthly P&I
- —
- Monthly cashflow
- —
- DSCR
- —
- Eligible?
- —
Short-term bridge; refi at stabilization.
Listing history 15 events
-
2026-06-15statusdays on market $97,500 Pending 51 DOM
-
2026-06-14days on market $97,500 Active 50 DOM
-
2026-06-13days on market $97,500 Active 49 DOM
-
2026-06-10days on market $97,500 Active 47 DOM
-
2026-06-09days on market $97,500 Active 46 DOM
-
2026-06-08days on market $97,500 Active 45 DOM
-
2026-06-07days on market $97,500 Active 44 DOM
-
2026-06-05days on market $97,500 Active 41 DOM
-
2026-06-03days on market $97,500 Active 40 DOM
-
2026-06-02days on market $97,500 Active 39 DOM
-
2026-06-01days on market $97,500 Active 38 DOM
-
2026-05-31days on market $97,500 Active 37 DOM
-
2026-05-30days on market $97,500 Active 36 DOM
-
2026-04-21$97,500 Active 1073-char remark
-
2025-08-22$165,000 Active
ⓘ Source: listings_history table (triggers on properties + properties_extension) + one-shot
backfill from property_details.listing_events for pre-trigger history.
Tax reassessment forecast LA · Resets to sale price
- Current annual tax
- $287 · $24/mo
- Projected year-2 tax
- $536 · $45/mo
- Expected delta
- +$249/yr (+$21/mo · 86.6%)
ⓘ Screening estimate from a state-policy table — verify with the county assessor before closing.
Climate risk First Street
- Flood 1/10 Low FEMA zone X · 0% chance over 30 yrs
- Wildfire 1/10 Low
- Heat 8/10 Severe 7 d/yr ≥110°F today · 20 d/yr by 30 yrs out
- Wind 8/10 Severe 80% chance of damaging wind over 30 yrs
- Air quality 1/10 Low 0 unhealthy d/yr today · 0 by 30 yrs out
Nearby sold comps map
Loading sold comps map…
Walkable amenities ~0.75 mi
Loading nearby amenities…
Taxation est. · year 1
- Rental income
- $12,022
- − Mortgage interest
- −$5,462
- − Property taxes
- −$287
- − Insurance
- −$488
- − Repairs & maintenance
- −$962
- − Management
- −$962
- − Depreciation
- −$2,836
- Taxable income
- $1,026
- Est. tax owed @ 24.0%
- −$246
- After-tax cash flow
- $2,341/yr
For passive investors: Depreciation is non-cash, so a rental often shows a tax loss while cash-flowing — sheltering income. Rental losses are passive: they offset passive income freely, and up to $25,000/yr can offset ordinary (W-2) income if you actively participate and your MAGI is under $100k (phasing out to $0 by $150k); unused losses carry forward. On sale, claimed depreciation is recaptured at up to 25%, and gains may owe capital-gains tax (a 1031 exchange can defer both). Figures are a year-1 estimate at your 24.0% rate — not tax advice; consult a CPA.
Schools (NCES district)
- District
- Morehouse Parish
- NCES district ID
- 2201110
- Math proficiency
- 10% ▼ -29.00%
- Reading proficiency
- 19% ▼ -29.00%
- Median HH income
- $30,482
- Composite
- 11.46/100
- National rank
- #9704
- State rank
- #83 of 98 in LA
Livability — Oak Ridge
- Score
- 55/100
- State rank
- #359
- US rank
- #23223
Category grades
Schools grade is shown separately in the Schools card above.
Census & demographics
- Population (ZIP)
- 1,167
Population outlook (Morehouse County) Hauer SSP2
- Today (2025)
- 23,631 people
- By 2030
- 22,114 · -6.4%
- By 2040
- 19,203 · -18.7%
- By 2050
- 16,698 · -29.3%
- By 2075
- 11,998 · -49.2%
- By 2100
- 8,622 · -63.5%
Race, ethnicity, and origin ACS 2023
- Neighborhood character
- Majority White (57%)
- Race & ethnicity
- White 57% Black 40% Two or more races 3%
- Common ancestry
- Serbian 3% Lithuanian 1%
Political lean MEDSL · Morehouse
- 2024 margin
- R (+19.4) · D 39.7% · R 59.0% · Other 1.3%
- 2008→2024 swing
- -8.3pp toward R · 2008: -11.1pp · 2024: -19.4pp
- All cycles
- 2024: R+19.4 2020: R+13.5 2016: R+11.4 2012: R+5.6 2008: R+11.1
Not yet ingested
- Civics
- —
Market trends
- HPI YoY
- ▲ 2.88%
- Current HPI
- 132.8758
- Rent YoY
- —
- Metro
- —
- State GDP YoY
- ▲ 3.29%
- F500 in state
- 10
Industry mix (Fortune 500 HQ in LA)
| Industry | F500 HQs | Revenue |
|---|---|---|
| Telecommunications | 2 | $23B |
|
||
| Utilities | 1 | $12B |
|
||
| Wholesale / Distribution | 1 | $5B |
|
||
| Advertising | 1 | $2B |
|
||
Price history
-40.9% since first listed3 events — show timeline
- 2026-06-14 Pending — NELABOR
- 2026-04-21 Listed $97,500 NELABOR
- 2025-08-22 Listed $165,000 NELABOR
Property tax history
+1.1%/yrLatest (2024): $287 · +8.0% YoY. Source: county tax records.
Cash-flow waterfall
monthlySold comps — $/sqft
last 12 mo · ≤1 miLoading sold comps…