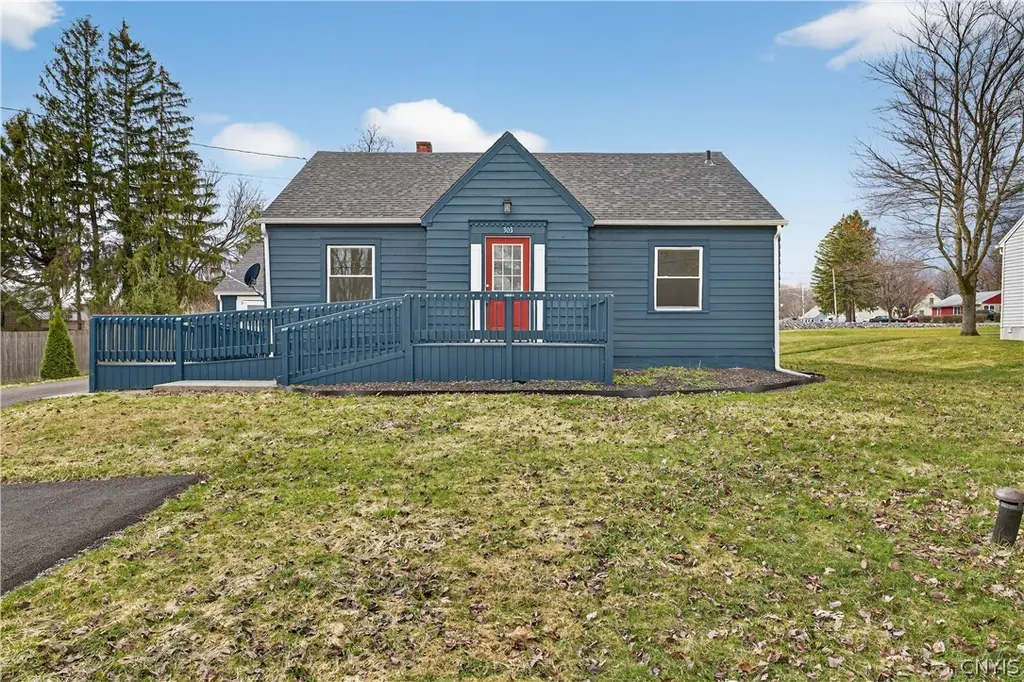
303 Fremont Rd
Minoa, NY 13057
$215,000D
3 bd · 1.0 ba ·
976 sqft ·
Built 1948
· SingleFamily
· Pending
· 5 DOM
Cashflow @ list (25.0% down · 7.5%)
Estimated rent
$2,064/mo
Mortgage (P&I)
−$1,127
Tax + insurance
−$542
HOA
−$0
Vac / Maint / Mgmt
−$433
Net cashflow
$-39/mo
Annual
$-465/yr
Cap rate
6.08%
Cash-on-cash
-0.77%
DSCR
0.97
1% rule
0.96%
Cash to close
$60,200
Investor read
- This is a 3-bed/1.0-bath single-family listed at $215k.
- At list price, monthly cash flow is $-39 ($-465/yr) — negative.
- To cash-flow at today's rent, offer at most $208k (3.2% below list).
- To meet the 1% rule (rent ≥ 1% of price), the offer needs to be $206k (4.0% below list).
- Only 5 days on market — expect competitive offers; lowballing is unlikely to land.
- Recommended offer: $206k (4.0% below list) — sets the bar for 1% rule.
- Local home prices are declining (-3.0%/yr); year-one equity from $1k of loan paydown is wiped out by about $6k of value loss. Plan a longer hold.
- Location reads 74/100 on livability (#295 in NY, #4,783 nationally) — a middle-class / working-renter tenant base. Strengths: housing A+, health & safety A, cost of living A-; Watch: employment C-, amenities F, commute F.
- East Syracuse Minoa Central School District (rural): math 46% / reading 53% proficiency, ranked #379 of 590 in NY (top 64%) — families likely to look elsewhere, expect single-tenant / working-renter base with shorter leases.
- Watch-outs: property tax is 2.5% of price; built in 1948 — expect roof / HVAC / electrical / plumbing capex.
- Market conditions: 58 active listings in the ZIP; solid renter incomes; 616 units permitted in Onondaga County in 2024 (256 in 5+ unit buildings).
- Onondaga County population projected to shrink 9% by 2050 — rents likely to lag national; underwrite the cash flow, not the appreciation.
- Current owner paid $82k; list at $215k implies a 162% gain — meaningful room to come down on a strong offer.
- Cap rate 6.1% vs local median 1.8% in Minoa — top-decile yield for the area; either an underpriced asset or a hidden risk that comps aren't pricing in. Stress-test before assuming the spread holds.
- This rent runs 31% of the median local income ($81k/yr) — at the standard rent-burdened threshold; future hikes will face affordability resistance.
Questions for listing agent
- What do current leases actually rent for vs. the listed asking? Can we see a recent rent roll and the last 12 months of T-12 income?
- Built in 1948 — when were the roof, HVAC, electrical panel, plumbing, and water heater last replaced?
- Property tax is high relative to price — has the assessment been appealed recently, and will the sale trigger a re-assessment?
- Is there a deadline driving the sale (1031 exchange, divorce, estate, relocation)? That informs how much negotiation room exists.
- The area grade is low — what's the realistic commute time and amenity access for the typical tenant pool here? Any planned neighborhood developments (good or bad) we should know about?
- What's the average days-on-market for RENTAL listings here right now (not sales)? A rising rental-DOM trend means longer vacancies and softer asking-rent achievability than the comps imply.
- What's the recent tenant-quality profile in this submarket — average credit score on applications, eviction rate, late-payment / NSF rate, and stable-employment percentage? A property-management company in the area should have these aggregated.
- How much new for-sale + rental construction is in the pipeline within 1–3 miles? Heavy new supply typically softens prices + rents 12–24 months out; constrained supply supports both.
CashFlowRE · CFR-WN4P1QB7R25HZH
· Data 3 weeks ago
cashflowre.app · 2026-05-29