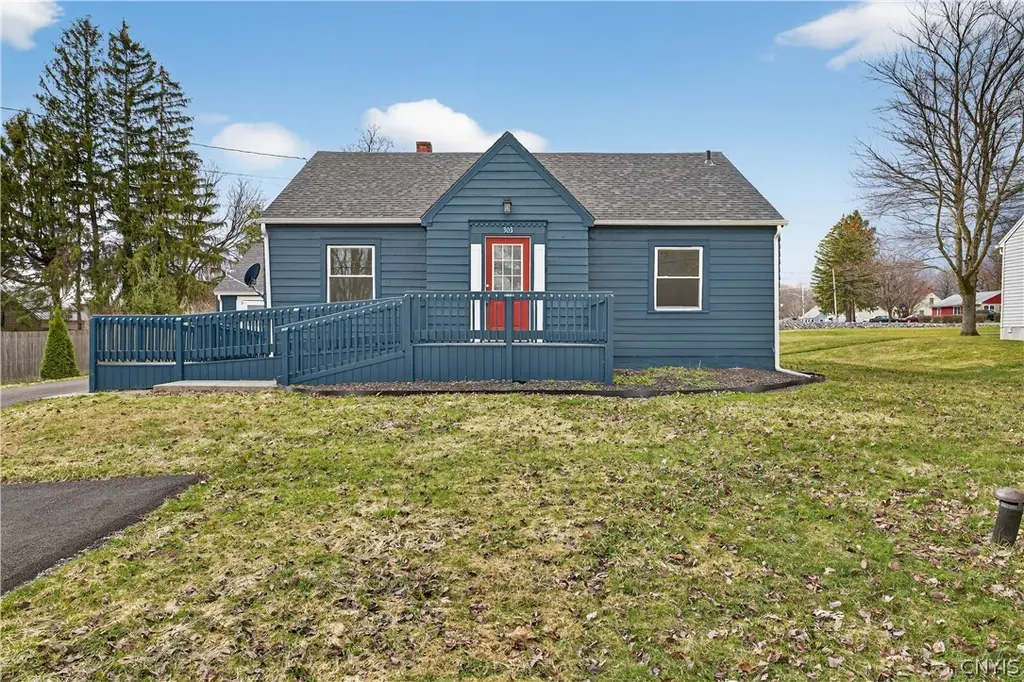
303 Fremont Rd · Minoa, NY
Flood risk 1/10 · Minimal
- FEMA flood zone
- X (unshaded)
- Chance of flooding over 30 yrs
- 0.0%
- Est. flood insurance / yr
- $473 – $860
Fire risk 1/10 · Minimal
- Est. fire insurance / yr
- $691 – $1,283
Heat risk 3/10 · Minor
- Hot days now (above 95°F)
- 7 days/yr
- Hot days in 30 yrs
- 16 days/yr
Wind risk 1/10 · Minimal
- Chance of severe wind over 30 yrs
- 1.0%
Air-quality risk 2/10 · Minimal
- Unhealthy air days now
- 0 days/yr
- Unhealthy air days in 30 yrs
- 1 days/yr
Risk factors via First Street. Map © Google.
Why this score? — see what drove the D grade
The composite is a weighted blend of 9 inputs, each scored 0–100. Each bar is that input's sub-score; the figure is the points it added to the 100-point composite (weight × sub-score).
- Cash flow +12.3/30.0
- ARV discount +7.2/15.0
- 1% rule +4.6/10.0
- Schools +4.3/10.0
- DSCR +3.7/10.0
- Livability +3.7/5.0
- Rent growth +2.5/5.0
- Condition / age +2.5/5.0
- Appreciation +0.0/10.0
$215,000
🖨 Deal sheet 📄 Offer letter ✓ Due diligence
Listing remarks
Welcome to this beautifully remodeled 3-bedroom, 1-bath home offering convenient single-floor living. The interior and exterior has been completely updated from new windows, new roof, updated electrical both house and detached garage, appliances, flooring and more! Providing a fresh modern feel throughout making this home truly move-in ready! This property also offers a spacious yard, perfect for outdoor enjoyment, gardening, or entertaining. The basement provides great potential to be finished, offering the opportunity to expand living space to fit your needs. Ideally located close to shops, schools, and everyday amenities, this home combines modern updates, accessibility, and future pot
Key facts
- Spacious yard
- Remodeled
- Single-floor living
Tags
Neighborhood map
What this means for you Summary
Snapshot
- This is a 3-bed/1.0-bath single-family listed at $215k.
Deal economics
- At list price, monthly cash flow is $-39 ($-465/yr) — negative.
- To cash-flow at today's rent, offer at most $208k (3.2% below list).
- To meet the 1% rule (rent ≥ 1% of price), the offer needs to be $206k (4.0% below list).
- Recommended offer: $206k (4.0% below list) — sets the bar for 1% rule.
- Cap rate 6.1% vs local median 1.8% in Minoa — top-decile yield for the area; either an underpriced asset or a hidden risk that comps aren't pricing in. Stress-test before assuming the spread holds.
Location & tenants
- Location reads 74/100 on livability (#295 in NY, #4,783 nationally) — a middle-class / working-renter tenant base. Strengths: housing A+, health & safety A, cost of living A-; Watch: employment C-, amenities F, commute F.
- East Syracuse Minoa Central School District (rural): math 46% / reading 53% proficiency, ranked #379 of 590 in NY (top 64%) — families likely to look elsewhere, expect single-tenant / working-renter base with shorter leases.
- Market conditions: 58 active listings in the ZIP; solid renter incomes; 616 units permitted in Onondaga County in 2024 (256 in 5+ unit buildings).
- This rent runs 31% of the median local income ($81k/yr) — at the standard rent-burdened threshold; future hikes will face affordability resistance.
Forward outlook
- Local home prices are declining (-3.0%/yr); year-one equity from $1k of loan paydown is wiped out by about $6k of value loss. Plan a longer hold.
- Onondaga County population projected to shrink 9% by 2050 — rents likely to lag national; underwrite the cash flow, not the appreciation.
Negotiation context
- Only 5 days on market — expect competitive offers; lowballing is unlikely to land.
- Current owner paid $82k; list at $215k implies a 162% gain — meaningful room to come down on a strong offer.
Risks & watch-outs
- Watch-outs: property tax is 2.5% of price; built in 1948 — expect roof / HVAC / electrical / plumbing capex.
Questions for the listing agent
- What do current leases actually rent for vs. the listed asking? Can we see a recent rent roll and the last 12 months of T-12 income?
- Built in 1948 — when were the roof, HVAC, electrical panel, plumbing, and water heater last replaced?
- Property tax is high relative to price — has the assessment been appealed recently, and will the sale trigger a re-assessment?
- Is there a deadline driving the sale (1031 exchange, divorce, estate, relocation)? That informs how much negotiation room exists.
- The area grade is low — what's the realistic commute time and amenity access for the typical tenant pool here? Any planned neighborhood developments (good or bad) we should know about?
- What's the average days-on-market for RENTAL listings here right now (not sales)? A rising rental-DOM trend means longer vacancies and softer asking-rent achievability than the comps imply.
- What's the recent tenant-quality profile in this submarket — average credit score on applications, eviction rate, late-payment / NSF rate, and stable-employment percentage? A property-management company in the area should have these aggregated.
- How much new for-sale + rental construction is in the pipeline within 1–3 miles? Heavy new supply typically softens prices + rents 12–24 months out; constrained supply supports both.
Investment metrics
- 1% rule
- 0.96% ✗
- Cap rate
- 6.08%
- Cash-on-cash
- -0.77%
- DSCR
- 0.97
- GRM
- 8.7
CMA / ARV
- ARV (on-the-fly)
- $213,744
- Comps found
- 12
Show comp detail 12 sales within ~0.75 mi
| Address | Dist | Beds/Ba | Sqft | Sold | Price | $/sf | Match |
|---|---|---|---|---|---|---|---|
| 303 Fremont Rd | 0.00mi | 3/1.0 | 976 (0%) | 1mo | $225,000 | $231 | 100 |
| 100 Patton Ave | 0.08mi | 3/1.5 | 999 (+2%) | 8mo | $227,500 | $228 | 84 |
| 106 W Dauenhauer St | 0.06mi | 3/1.0 | 1,047 (+7%) | 3mo | $255,000 | $244 | 83 |
| 104 Fremont Rd | 0.18mi | 3/1.0 | 992 (+2%) | 17mo | $175,000 | $176 | 75 |
| 208 Cannonball Way | 0.35mi | 3/1.0 | 936 (-4%) | 2mo | $237,000 | $253 | 75 |
| 104 E Richmond Rd | 0.15mi | 3/1.0 | 936 (-4%) | 14mo | $190,000 | $203 | 75 |
| 113 Davis St | 0.16mi | 2/1.0 (-1) | 934 (-4%) | 20mo | $200,000 | $214 | 64 |
| 112 Kendall Dr W | 0.11mi | 2/1.0 (-1) | 1,098 (+12%) | 7mo | $241,000 | $219 | 64 |
| 212 Cannonball Way | 0.35mi | 3/1.0 | 999 (+2%) | 24mo | $181,000 | $181 | 60 |
| 100 Stillwell Ter | 0.60mi | 2/1.0 (-1) | 936 (-4%) | 1mo | $227,750 | $243 | 60 |
| 106 Crysler Dr | 0.21mi | 3/1.0 | 1,088 (+12%) | 15mo | $225,000 | $207 | 58 |
| 300 Manor Dr | 0.66mi | 3/1.0 | 1,064 (+9%) | 20mo | $213,000 | $200 | 38 |
Match score weights: distance 35% · size 25% · config 20% · recency 20%. Top-matched comps best support the ARV.
Projected returns pro-forma
-3.0% appreciation · 3.0% rent growth · sell at horizon
- IRR
- -17.5%
- Equity multiple
- 0.38×
- Total profit
- $-37,163
- Equity at exit
- $32,057
- IRR
- -9.4%
- Equity multiple
- 0.42×
- Total profit
- $-34,953
- Equity at exit
- $18,589
Cash invested: $60,200 (down + closing). Projections, not guarantees.
Landlord ↔ Tenant lean methodology
- Overall (STATE)
- 15 Strongly Tenant-Friendly
- State New York
- 15 Strongly Tenant-Friendly · D+10
- County
- — inherits STATE
- City
- — inherits STATE
ZIP-level market 13057
- Home prices YoY
- -11.1%
- Active inventory
- 58
- Price-to-rent
- 8.7×
Monthly cashflow live
- Estimated rent
- $2,064 medium interval (Pro) →
- Mortgage (P&I)
- −$1,127
- Tax from tax record
- −$452 /mo · $5,426/yr
- Insurance
- −$90
- HOA
- −$0
- Vacancy / Maint / Mgmt
- −$433
- Net cashflow
- $-39
Break-even live
UW: 25.0% down · 7.5% · 30yr · 1.5% tax · 5.0% vac · 8.0% maint · 8.0% mgmt
Financing live
Cash to close
- Down payment
- $53,750
- Closing costs
- $6,450
- Reserves months
- —
- Total cash needed
- —
Loan-product check · same deal, 3 products live
Conventional
25% down · 7.5% · 30yr
- Down + closing
- —
- Monthly P&I
- —
- Monthly cashflow
- —
- DSCR
- —
- Eligible?
- —
Personal DTI + credit; lowest rate.
DSCR
20% down · 8.5% · 30yr
- Down + closing
- —
- Monthly P&I
- —
- Monthly cashflow
- —
- DSCR
- —
- Eligible?
- —
No personal income docs; deal must DSCR.
Hard money
10% down · 12.0% · 12mo
- Down + closing
- —
- Monthly P&I
- —
- Monthly cashflow
- —
- DSCR
- —
- Eligible?
- —
Short-term bridge; refi at stabilization.
Listing history 3 events
-
2026-03-23status Pending
-
2026-03-18$215,000 Active
-
2024-10-23soldstatus $82,000
ⓘ Source: listings_history table (triggers on properties + properties_extension) + one-shot
backfill from property_details.listing_events for pre-trigger history.
Tax reassessment forecast NY · Partial reset (capped growth)
- Current annual tax
- $5,426 · $452/mo
- Projected year-2 tax
- $5,426 · $452/mo
- Expected delta
- $0/yr ($0/mo · 0.0%)
ⓘ Screening estimate from a state-policy table — verify with the county assessor before closing.
Climate risk First Street
- Flood 1/10 Low FEMA zone X (unshaded) · 0% chance over 30 yrs
- Wildfire 1/10 Low
- Heat 3/10 Moderate 7 d/yr ≥95°F today · 16 d/yr by 30 yrs out
- Wind 1/10 Low 100% chance of damaging wind over 30 yrs
- Air quality 2/10 Low 0 unhealthy d/yr today · 1 by 30 yrs out
Nearby sold comps map
Loading sold comps map…
Walkable amenities ~0.75 mi
Loading nearby amenities…
Taxation est. · year 1
- Rental income
- $24,767
- − Mortgage interest
- −$12,043
- − Property taxes
- −$5,426
- − Insurance
- −$1,075
- − Repairs & maintenance
- −$1,981
- − Management
- −$1,981
- − Depreciation
- −$6,255
- Taxable loss
- −$3,995
- Est. tax savings @ 24.0%
- +$959
- After-tax cash flow
- $494/yr
For passive investors: Depreciation is non-cash, so a rental often shows a tax loss while cash-flowing — sheltering income. Rental losses are passive: they offset passive income freely, and up to $25,000/yr can offset ordinary (W-2) income if you actively participate and your MAGI is under $100k (phasing out to $0 by $150k); unused losses carry forward. On sale, claimed depreciation is recaptured at up to 25%, and gains may owe capital-gains tax (a 1031 exchange can defer both). Figures are a year-1 estimate at your 24.0% rate — not tax advice; consult a CPA.
Schools (NCES district)
- District
- East Syracuse Minoa Central School District
- NCES district ID
- 3609990
- Math proficiency
- 46% ▼ -6.00%
- Reading proficiency
- 53% ▲ 9.00%
- Median HH income
- $55,801
- Composite
- 42.9/100
- National rank
- #3122
- State rank
- #379 of 590 in NY
Livability — Minoa
- Score
- 74/100
- State rank
- #295
- US rank
- #4783
Category grades
Schools grade is shown separately in the Schools card above.
Census & demographics
- County
- Onondaga County · 247,257 people
- City population
- 3,657
- Metro
- Syracuse, NY
- Population (ZIP)
- 14,253
- Household income
- $80,900
- Rent vs Own
- Severe rent burden
- 250.0
Population outlook (Onondaga County) Hauer SSP2
- Today (2025)
- 467,894 people
- By 2030
- 463,381 · -1.0%
- By 2040
- 447,697 · -4.3%
- By 2050
- 426,399 · -8.9%
- By 2075
- 373,661 · -20.1%
- By 2100
- 307,967 · -34.2%
Race, ethnicity, and origin ACS 2023
- Neighborhood character
- Predominantly White (88%)
- Race & ethnicity
- White 88% Two or more races 5% Hispanic / Latino 3% Asian 2% Black 2%
- Common ancestry
- Romanian 5% Lithuanian 4% American 3%
- Foreign-born
- 6% · Canada, Vietnam
- Languages at home
- 92% English-only · Russian/Polish/Slavic 3% Spanish 1% Other Indo-European 1%
Political lean MEDSL · Onondaga
- 2024 margin
- D (+17.3) · D 58.6% · R 41.4%
- 2008→2024 swing
- -3.0pp toward R · 2008: 20.3pp · 2024: 17.3pp
- All cycles
- 2024: D+17.3 2020: D+20.6 2016: D+12.8 2012: D+21.1 2008: D+20.3
Not yet ingested
- Civics
- —
Market trends
- HPI YoY
- ▼ -39.50%
- Current HPI
- 316.8595
- Rent YoY
- —
- Metro
- Syracuse, NY
- State GDP YoY
- ▲ 2.60%
- F500 in state
- 92
Industry mix (Fortune 500 HQ in NY)
| Industry | F500 HQs | Revenue |
|---|---|---|
| Financial Services | 10 | $950B |
|
||
| Consumer Goods | 9 | $162B |
|
||
| Insurance | 4 | $225B |
|
||
| Telecommunications | 2 | $144B |
|
||
| Pharmaceuticals | 2 | $112B |
|
||
| Media / Entertainment | 2 | $69B |
|
||
Price history
+162.2% since first listed3 events — show timeline
- 2026-03-23 Pending — CNYIS
- 2026-03-18 Listed $215,000 CNYIS
- 2024-10-23 Sold (Public Records) $82,000 Public Records
Property tax history
+4.8%/yrLatest (2025): $5,426 · +3.3% YoY. Source: county tax records.
Cash-flow waterfall
monthlySold comps — $/sqft
last 12 mo · ≤1 miLoading sold comps…