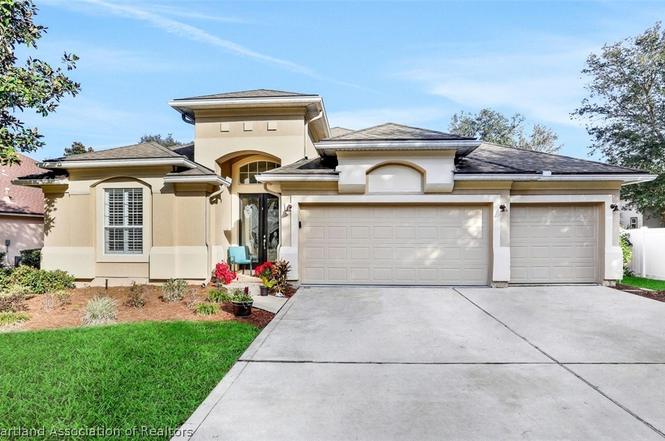
184 Oak Common Ave
Nocatee, FL 32095
$5,000D+
4 bd · 3.0 ba ·
2,495 sqft ·
Built 2003
· SingleFamily
· Active
· 8 DOM
Cashflow @ list (25.0% down · 7.5%)
Estimated rent
$3,610/mo
Mortgage (P&I)
−$26
Tax + insurance
−$8
HOA
−$0
Vac / Maint / Mgmt
−$758
Net cashflow
$2,817/mo
Annual
$33,808/yr
Cap rate
682.45%
Cash-on-cash
2414.84%
DSCR
108.45
1% rule
72.20%
Cash to close
$1,400
Investor read
- This is a 4-bed/3.0-bath single-family listed at $5k.
- At list price, monthly cash flow is $3k ($34k/yr) — positive.
- The deal already cash-flows at list — no discount required.
- Meets the 1% rule at list price ($4k rent vs $5k).
- Only 8 days on market — expect competitive offers; lowballing is unlikely to land.
- Local home prices are declining (-3.0%/yr); year-one equity from $35 of loan paydown is wiped out by about $150 of value loss. Plan a longer hold.
- Location reads 70/100 on livability (#425 in FL) — a middle-class / working-renter tenant base. Strengths: schools A+, crime A+, employment A+; Watch: amenities F, commute F, cost of living F.
- St. Johns (rural): math 75% / reading 73% proficiency, ranked #2 of 73 in FL (top 3%) — strong family-tenant draw, lease renewals of 3-5y typical; only 20% free/reduced lunch — higher-income household profile.
- Market conditions: Rents rising (+1.8%/yr); 456 active listings in the ZIP; 5 comparable units currently listed for rent nearby; rentals leasing fast (median 11d on market — plan ~1-2 weeks tenant-placement turnaround); high-income renter base; 5,575 units permitted in St. Johns County in 2024 (584 in 5+ unit buildings).
- St. Johns County population projected at +60% by 2050 — long-run rental-demand tailwind backs the buy-and-hold thesis.
- 13 sale attempts since 9y ago with the ask held roughly flat each time — persistent listings suggest the price (not the market) is what's stuck; bring a comps-based counter.
- At projected returns (-3.0% appreciation + 1.8% rent growth), your $1k cash investment doubles in ~1 year — after that, you're playing with house money.
- Climate carrying-cost: severe wind risk, 99% chance of damaging wind over 30y; extreme-heat days projected 7→21/yr by 2055 (HVAC capex compounding) — expect insurance premiums to compound above CPI over the hold.
- Cap rate 682.4% vs local median 2.5% in Nocatee — top-decile yield for the area; either an underpriced asset or a hidden risk that comps aren't pricing in. Stress-test before assuming the spread holds.
- This rent runs 32% of the median local income ($136k/yr) — at the standard rent-burdened threshold; future hikes will face affordability resistance.
Questions for listing agent
- Is there a deadline driving the sale (1031 exchange, divorce, estate, relocation)? That informs how much negotiation room exists.
- Schools are A-rated — typically a magnet for longer-tenancy family renters. What's the average tenant stay here, and is there a school-zone premium baked into asking?
- The area grade is low — what's the realistic commute time and amenity access for the typical tenant pool here? Any planned neighborhood developments (good or bad) we should know about?
- What's the average days-on-market for RENTAL listings here right now (not sales)? A rising rental-DOM trend means longer vacancies and softer asking-rent achievability than the comps imply.
- What's the recent tenant-quality profile in this submarket — average credit score on applications, eviction rate, late-payment / NSF rate, and stable-employment percentage? A property-management company in the area should have these aggregated.
- How much new for-sale + rental construction is in the pipeline within 1–3 miles? Heavy new supply typically softens prices + rents 12–24 months out; constrained supply supports both.
CashFlowRE · CFR-WRHDMXEVJDHD6Q
· Data 2 days ago
cashflowre.app · 2026-05-29