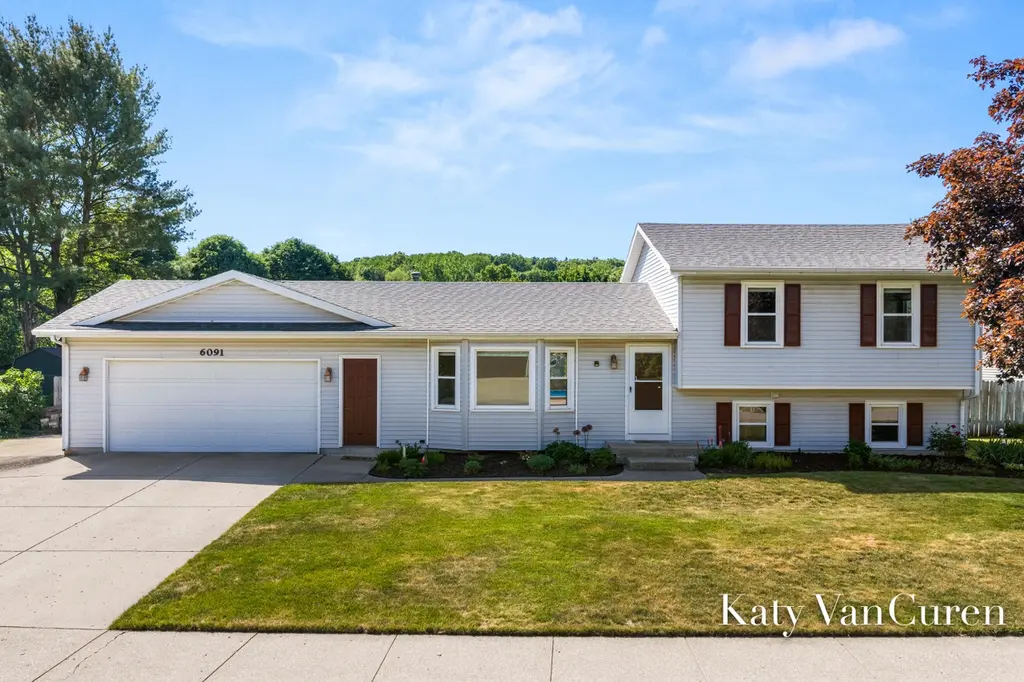
6091 Rogue River Meadows Dr NE
Plainfield, MI 49306
$425,000F
4 bd · 2.5 ba ·
1,861 sqft ·
Built 1989
· SingleFamily
· Active
· 12 DOM
Cashflow @ list (25.0% down · 7.5%)
Estimated rent
$3,250/mo
Mortgage (P&I)
−$2,229
Tax + insurance
−$437
HOA
−$0
Vac / Maint / Mgmt
−$682
Net cashflow
$-99/mo
Annual
$-1,183/yr
Cap rate
6.01%
Cash-on-cash
-0.99%
DSCR
0.96
1% rule
0.76%
Cash to close
$119,000
Investor read
- This is a 4-bed/2.5-bath single-family listed at $425k.
- At list price, monthly cash flow is $-99 ($-1k/yr) — negative.
- To cash-flow at today's rent, offer at most $408k (4.1% below list).
- To meet the 1% rule (rent ≥ 1% of price), the offer needs to be $325k (23.5% below list).
- Only 12 days on market — expect competitive offers; lowballing is unlikely to land.
- Recommended offer: $325k (23.5% below list) — sets the bar for 1% rule.
- Local home prices are declining (-3.0%/yr); year-one equity from $3k of loan paydown is wiped out by about $13k of value loss. Plan a longer hold.
- Location reads: area grade F — affects rentability + tenant quality, not the cash-flow math above.
- Rockford Public Schools (suburban): math 59% / reading 64% proficiency, ranked #28 of 540 in MI (top 5%) — acceptable for families but not a draw, mixed tenant base, ~2y average lease; only 12% free/reduced lunch — higher-income household profile.
- Zoned schools: Belmont Elementary School (math 67% / reading 67%, grade B+, #105 of 1,397 statewide, top 9%, 354 students, 16% FRL); North Rockford Middle School (math 58% / reading 63%, grade B+, #51 of 493 statewide, top 11%, 885 students, 19% FRL); Rockford High School (math 46% / reading 71%, grade C, #91 of 713 statewide, top 13%, 1,819 students, 14% FRL) — zoned schools at 16% FRL track the district average.
- Market conditions: 66 active listings in the ZIP; 1 comparable units currently listed for rent nearby; 2,253 units permitted in Kent County in 2024 (969 in 5+ unit buildings).
- Kent County population projected at +22% by 2050 — long-run rental-demand tailwind backs the buy-and-hold thesis.
- 5 sale attempts since 18y ago with the ask held roughly flat each time — persistent listings suggest the price (not the market) is what's stuck; bring a comps-based counter.
- Current owner paid $168k; list at $425k implies a 154% gain — meaningful room to come down on a strong offer.
Questions for listing agent
- What do current leases actually rent for vs. the listed asking? Can we see a recent rent roll and the last 12 months of T-12 income?
- Is there a deadline driving the sale (1031 exchange, divorce, estate, relocation)? That informs how much negotiation room exists.
- The area grade is low — what's the realistic commute time and amenity access for the typical tenant pool here? Any planned neighborhood developments (good or bad) we should know about?
- What's the average days-on-market for RENTAL listings here right now (not sales)? A rising rental-DOM trend means longer vacancies and softer asking-rent achievability than the comps imply.
- What's the recent tenant-quality profile in this submarket — average credit score on applications, eviction rate, late-payment / NSF rate, and stable-employment percentage? A property-management company in the area should have these aggregated.
- How much new for-sale + rental construction is in the pipeline within 1–3 miles? Heavy new supply typically softens prices + rents 12–24 months out; constrained supply supports both.
CashFlowRE · CFR-WVXETP1WSKYMQS
· Data 13 h ago
cashflowre.app · 2026-05-29