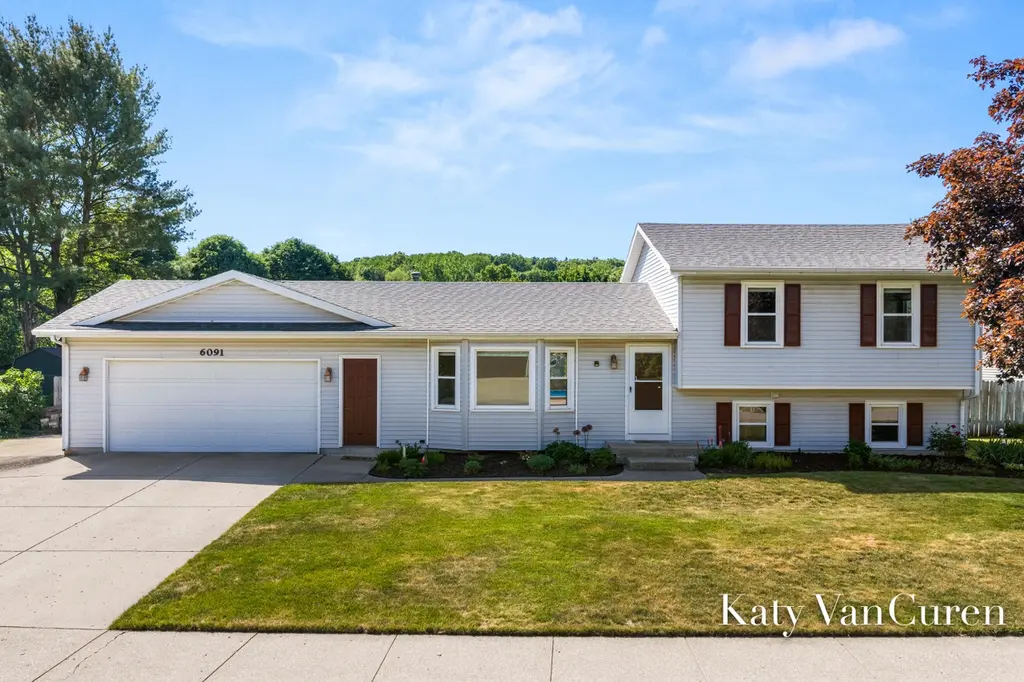
6091 Rogue River Meadows Dr NE · Plainfield, MI
Flood risk 1/10 · Minimal
- FEMA flood zone
- X (unshaded)
- Chance of flooding over 30 yrs
- 0.0%
- Est. flood insurance / yr
- $473 – $860
Fire risk 1/10 · Minimal
- Est. fire insurance / yr
- $784 – $1,456
Heat risk 2/10 · Minimal
- Hot days now (above 96°F)
- 7 days/yr
- Hot days in 30 yrs
- 16 days/yr
Wind risk 2/10 · Minimal
- Chance of severe wind over 30 yrs
- —
Air-quality risk 2/10 · Minimal
- Unhealthy air days now
- 1 days/yr
- Unhealthy air days in 30 yrs
- 2 days/yr
Risk factors via First Street. Map © Google.
Why this score? — see what drove the F grade
The composite is a weighted blend of 9 inputs, each scored 0–100. Each bar is that input's sub-score; the figure is the points it added to the 100-point composite (weight × sub-score).
- Cash flow +12.0/30.0
- Schools +5.5/10.0
- DSCR +3.6/10.0
- 1% rule +2.6/10.0
- ARV discount +2.6/15.0
- Rent growth +2.5/5.0
- Livability +2.5/5.0
- Condition / age +2.5/5.0
- Appreciation +0.0/10.0
$425,000
🖨 Deal sheet (PDF) 📄 Offer letter ✓ Due diligence
Listing remarks MLS
Welcome home to this meticulously maintained 2,000 sq. ft 4 bed/2.5 bath residence nestled in the highly sought-after Rockford community. Known for its award winning schools and small-town charm, this location offers the perfect blend of comfort and convenience. Step inside to find thoughtful updates everywhere with improvements showcased in the kitchen, bathrooms, and beyond-creating a move-in-ready space ready to call home. Enjoy an active lifestyle just moments from the scenic White Pine Trail, perfect for walking, running or biking. Commuters will appreciate the easy access to Grand Rapids too. Outside, the home truly shines. The beautifully maintained yard is the envy of the neighborhood, offering a private oasis for relaxation and entertaining. Take full advantage of summer with your own pool complete with a huge deck and recent updates including a new pump, liner and cover. More than a home- a lifestyle is found here.
Key facts
- White pine trail
- Private oasis
- Own pool
Tags
Property features AI
Exterior
- Parking: Attached 2-car garage
- Utilities: Public water; Natural gas connected; Natural gas water heater
- Home design: Single family residence; Residential property
- Construction: Built in 1989; Vinyl siding; Composition/shingle roof; Partial basement
- Exterior features: Sidewalk; Shed(s); Paved road access
Interior
- Kitchen: Dishwasher; Range; Refrigerator; Pantry
- Bedrooms: Bedroom 2; Bedroom 3; Bedroom 4
- Bathrooms: 2 full bathrooms; 1 half bathroom
- Heating & cooling: Forced air heating; Central cooling
- Interior features: Pantry; Partial basement; Nine total rooms
- Laundry & utility: Washer; Dryer
Neighborhood map
What this means for you Summary
Snapshot
- This is a 4-bed/2.5-bath single-family listed at $425k.
Deal economics
- At list price, monthly cash flow is $-99 ($-1k/yr) — negative.
- To cash-flow at today's rent, offer at most $408k (4.1% below list).
- To meet the 1% rule (rent ≥ 1% of price), the offer needs to be $325k (23.5% below list).
- Recommended offer: $325k (23.5% below list) — sets the bar for 1% rule.
Location & tenants
- Location reads: area grade F — affects rentability + tenant quality, not the cash-flow math above.
- Rockford Public Schools (suburban): math 59% / reading 64% proficiency, ranked #28 of 540 in MI (top 5%) — acceptable for families but not a draw, mixed tenant base, ~2y average lease; only 12% free/reduced lunch — higher-income household profile.
- Zoned schools: Belmont Elementary School (math 67% / reading 67%, grade B+, #105 of 1,397 statewide, top 9%, 354 students, 16% FRL); North Rockford Middle School (math 58% / reading 63%, grade B+, #51 of 493 statewide, top 11%, 885 students, 19% FRL); Rockford High School (math 46% / reading 71%, grade C, #91 of 713 statewide, top 13%, 1,819 students, 14% FRL) — zoned schools at 16% FRL track the district average.
- Market conditions: 66 active listings in the ZIP; 1 comparable units currently listed for rent nearby; 2,253 units permitted in Kent County in 2024 (969 in 5+ unit buildings).
Forward outlook
- Local home prices are declining (-3.0%/yr); year-one equity from $3k of loan paydown is wiped out by about $13k of value loss. Plan a longer hold.
- Kent County population projected at +22% by 2050 — long-run rental-demand tailwind backs the buy-and-hold thesis.
Negotiation context
- Only 12 days on market — expect competitive offers; lowballing is unlikely to land.
- 5 sale attempts since 18y ago with the ask held roughly flat each time — persistent listings suggest the price (not the market) is what's stuck; bring a comps-based counter.
- Current owner paid $168k; list at $425k implies a 154% gain — meaningful room to come down on a strong offer.
Questions for the listing agent
- What do current leases actually rent for vs. the listed asking? Can we see a recent rent roll and the last 12 months of T-12 income?
- Is there a deadline driving the sale (1031 exchange, divorce, estate, relocation)? That informs how much negotiation room exists.
- The area grade is low — what's the realistic commute time and amenity access for the typical tenant pool here? Any planned neighborhood developments (good or bad) we should know about?
- What's the average days-on-market for RENTAL listings here right now (not sales)? A rising rental-DOM trend means longer vacancies and softer asking-rent achievability than the comps imply.
- What's the recent tenant-quality profile in this submarket — average credit score on applications, eviction rate, late-payment / NSF rate, and stable-employment percentage? A property-management company in the area should have these aggregated.
- How much new for-sale + rental construction is in the pipeline within 1–3 miles? Heavy new supply typically softens prices + rents 12–24 months out; constrained supply supports both.
Investment metrics
- 1% rule
- 0.76% ✗
- Cap rate
- 6.01%
- Cash-on-cash
- -0.99%
- DSCR
- 0.96
- GRM
- 10.9
CMA / ARV
- ARV (on-the-fly)
- $383,366
- Comps found
- 12
Show comp detail 12 sales within ~0.75 mi
| Address | Dist | Beds/Ba | Sqft | Sold | Price | $/sf | Match |
|---|---|---|---|---|---|---|---|
| 2155 Aaronsway Ct NE | 0.16mi | 4/2.0 | 1,968 (+6%) | 3mo | $415,000 | $211 | 78 |
| 6017 Rogue River Meadows Dr NE | 0.09mi | 4/2.0 | 1,821 (-2%) | 16mo | $415,000 | $228 | 77 |
| 6150 Rogue River Meadows Dr NE | 0.07mi | 4/2.0 | 2,008 (+8%) | 6mo | $380,500 | $189 | 76 |
| 2151 Rogue River Rd NE | 0.11mi | 3/2.0 (-1) | 2,006 (+8%) | 3mo | $350,700 | $175 | 73 |
| 2142 Belmont Farms Cir | 0.23mi | 3/2.5 (-1) | 1,964 (+6%) | 7mo | $492,000 | $251 | 69 |
| 6026 Belmont Ave NE | 0.38mi | 3/1.5 (-1) | 1,848 (-1%) | 8mo | $345,500 | $187 | 66 |
| 2183 Aaronsway Ct NE | 0.18mi | 4/1.5 | 2,006 (+8%) | 11mo | $410,000 | $204 | 66 |
| 6130 Belshire Ave NE | 0.66mi | 4/2.0 | 1,790 (-4%) | 3mo | $435,000 | $243 | 58 |
| 5720 Belmont Ave NE | 0.60mi | 4/2.5 | 1,964 (+6%) | 11mo | $405,000 | $206 | 54 |
| 1668 Rogue River Rd NE | 0.46mi | 3/2.0 (-1) | 1,682 (-10%) | 18mo | $369,900 | $220 | 41 |
| 2588 Jacor Pl NE | 0.59mi | 3/1.5 (-1) | 1,654 (-11%) | 7mo | $337,500 | $204 | 39 |
| 2461 Rogue River Rd NE | 0.44mi | 3/1.0 (-1) | 1,611 (-13%) | 14mo | $327,000 | $203 | 34 |
Match score weights: distance 35% · size 25% · config 20% · recency 20%. Top-matched comps best support the ARV.
Projected returns pro-forma
-3.0% appreciation · 3.0% rent growth · sell at horizon
- IRR
- -18.0%
- Equity multiple
- 0.37×
- Total profit
- $-75,264
- Equity at exit
- $63,369
- IRR
- -10.2%
- Equity multiple
- 0.38×
- Total profit
- $-74,101
- Equity at exit
- $36,746
Cash invested: $119,000 (down + closing). Projections, not guarantees.
Landlord ↔ Tenant lean methodology
- Overall (STATE)
- 62 Landlord-Friendly
- State Michigan
- 62 Landlord-Friendly · EVEN
- County
- — inherits STATE
- City
- — inherits STATE
ZIP-level market 49306
- Active inventory
- 66
- Price-to-rent
- 10.9×
Monthly cashflow live
- Estimated rent
- $3,250 medium interval (Pro) →
- Mortgage (P&I)
- −$2,229
- Tax from tax record
- −$260 /mo · $3,123/yr
- Insurance
- −$177
- HOA
- −$0
- Vacancy / Maint / Mgmt
- −$682
- Net cashflow
- $-99
Break-even live
Sensitivity live
| Price | -10% $142 | -5% $22 | +0% $-99 | +5% $-219 | +10% $-339 |
|---|---|---|---|---|---|
| Rent | -10% $-355 | -5% $-227 | +0% $-99 | +5% $30 | +10% $158 |
| Rate | -1.0pp $115 | -0.5pp $10 | base $-99 | +0.5pp $-209 | +1.0pp $-321 |
UW: 25.0% down · 7.5% · 30yr · 1.5% tax · 5.0% vac · 8.0% maint · 8.0% mgmt
Financing live
Cash to close
- Down payment
- $106,250
- Closing costs
- $12,750
- Reserves months
- —
- Total cash needed
- —
Loan-product check · same deal, 3 products live
Conventional
25% down · 7.5% · 30yr
- Down + closing
- —
- Monthly P&I
- —
- Monthly cashflow
- —
- DSCR
- —
- Eligible?
- —
Personal DTI + credit; lowest rate.
DSCR
20% down · 8.5% · 30yr
- Down + closing
- —
- Monthly P&I
- —
- Monthly cashflow
- —
- DSCR
- —
- Eligible?
- —
No personal income docs; deal must DSCR.
Hard money
10% down · 12.0% · 12mo
- Down + closing
- —
- Monthly P&I
- —
- Monthly cashflow
- —
- DSCR
- —
- Eligible?
- —
Short-term bridge; refi at stabilization.
Rent comps 1 comps
| Address | Beds | Baths | Sqft | Rent | $/sqft | DOM | Units | Dist |
|---|---|---|---|---|---|---|---|---|
| 5071 Wabash Ct NE Grand Rapids, MI | 4.0 | 2.0 | 2418 | $3,250 | $1.34 | 4d | 1 | 1.34mi |
Listing history 9 events
-
2026-06-22days on market $425,000 Active 12 DOM
-
2026-06-18days on market $425,000 Active 9 DOM
-
2026-06-17days on market $425,000 Active 8 DOM
-
2026-06-16days on market $425,000 Active 7 DOM
-
2026-06-15days on market $425,000 Active 6 DOM
-
2026-06-14days on market $425,000 Active 4 DOM
-
2026-06-13days on market $425,000 Active 3 DOM
-
2026-06-09remarks 699-char remark
Show marketing remark (938 chars)
Welcome home to this meticulously maintained 2,000 sq. ft 4 bed/2.5 bath residence nestled in the highly sought-after Rockford community. Known for its award winning schools and small-town charm, this location offers the perfect blend of comfort and convenience. Step inside to find thoughtful updates everywhere with improvements showcased in the kitchen, bathrooms, and beyond-creating a move-in-ready space ready to call home. Enjoy an active lifestyle just moments from the scenic White Pine Trail, perfect for walking, running or biking. Commuters will appreciate the easy access to Grand Rapids too. Outside, the home truly shines. The beautifully maintained yard is the envy of the neighborhood, offering a private oasis for relaxation and entertaining. Take full advantage of summer with your own pool complete with a huge deck and recent updates including a new pump, liner and cover. More than a home- a lifestyle is found here.
-
2026-06-09$425,000 Active 1 DOM
Show marketing remark (938 chars)
Welcome home to this meticulously maintained 2,000 sq. ft 4 bed/2.5 bath residence nestled in the highly sought-after Rockford community. Known for its award winning schools and small-town charm, this location offers the perfect blend of comfort and convenience. Step inside to find thoughtful updates everywhere with improvements showcased in the kitchen, bathrooms, and beyond-creating a move-in-ready space ready to call home. Enjoy an active lifestyle just moments from the scenic White Pine Trail, perfect for walking, running or biking. Commuters will appreciate the easy access to Grand Rapids too. Outside, the home truly shines. The beautifully maintained yard is the envy of the neighborhood, offering a private oasis for relaxation and entertaining. Take full advantage of summer with your own pool complete with a huge deck and recent updates including a new pump, liner and cover. More than a home- a lifestyle is found here.
ⓘ Source: listings_history table (triggers on properties + properties_extension) + one-shot
backfill from property_details.listing_events for pre-trigger history.
Tax reassessment forecast MI · Partial reset (capped growth)
- Current annual tax
- $3,123 · $260/mo
- Projected year-2 tax
- $4,834 · $403/mo
- Expected delta
- +$1,711/yr (+$143/mo · 54.8%)
ⓘ Screening estimate from a state-policy table — verify with the county assessor before closing.
Climate risk First Street
- Flood 1/10 Low FEMA zone X (unshaded) · 0% chance over 30 yrs
- Wildfire 1/10 Low
- Heat 2/10 Low 7 d/yr ≥96°F today · 16 d/yr by 30 yrs out
- Wind 2/10 Low
- Air quality 2/10 Low 1 unhealthy d/yr today · 2 by 30 yrs out
Nearby sold comps map
Loading sold comps map…
Walkable amenities ~0.75 mi
Loading nearby amenities…
Taxation est. · year 1
- Rental income
- $39,000
- − Mortgage interest
- −$23,807
- − Property taxes
- −$3,123
- − Insurance
- −$2,125
- − Repairs & maintenance
- −$3,120
- − Management
- −$3,120
- − Depreciation
- −$12,364
- Taxable loss
- −$8,658
- Est. tax savings @ 24.0%
- +$2,078
- After-tax cash flow
- $895/yr
For passive investors: Depreciation is non-cash, so a rental often shows a tax loss while cash-flowing — sheltering income. Rental losses are passive: they offset passive income freely, and up to $25,000/yr can offset ordinary (W-2) income if you actively participate and your MAGI is under $100k (phasing out to $0 by $150k); unused losses carry forward. On sale, claimed depreciation is recaptured at up to 25%, and gains may owe capital-gains tax (a 1031 exchange can defer both). Figures are a year-1 estimate at your 24.0% rate — not tax advice; consult a CPA.
Schools (NCES district)
- District
- Rockford Public Schools
- NCES district ID
- 2630030
- Math proficiency
- 59% ▼ -5.00%
- Reading proficiency
- 64% ▼ -2.00%
- Median HH income
- $79,800
- Composite
- 55.16/100
- National rank
- #1276
- State rank
- #28 of 540 in MI
Livability — Plainfield
No livability data for this city. (Only ~50 U.S. cities are tracked.)
Census & demographics
- Population (ZIP)
- 10,806
Population outlook (Kent County) Hauer SSP2
- Today (2025)
- 712,484 people
- By 2030
- 748,618 · +5.1%
- By 2040
- 814,777 · +14.4%
- By 2050
- 868,556 · +21.9%
- By 2075
- 966,487 · +35.7%
- By 2100
- 967,975 · +35.9%
Race, ethnicity, and origin ACS 2023
- Neighborhood character
- Predominantly White (87%)
- Race & ethnicity
- White 87% Hispanic / Latino 8% Two or more races 6% Black 1%
- Hispanic origin (detail)
- Mexican 4% Cuban 2%
- Common ancestry
- Iranian 12% Romanian 12% Lithuanian 5%
- Foreign-born
- 3% · Canada, Jamaica
- Languages at home
- 96% English-only · Spanish 3%
Political lean MEDSL · Kent
- 2024 margin
- Lean D (+5.4) · D 51.8% · R 46.5% · Other 1.7%
- 2008→2024 swing
- +4.8pp toward D · 2008: 0.5pp · 2024: 5.4pp
- All cycles
- 2024: D+5.4 2020: D+6.1 2016: R+3.1 2012: R+7.9 2008: D+0.5
Not yet ingested
- Civics
- —
Market trends
- HPI YoY
- ▼ -146.39%
- Current HPI
- 246.3054
- Rent YoY
- —
- Metro
- —
- State GDP YoY
- ▲ 1.37%
- F500 in state
- 28
Industry mix (Fortune 500 HQ in MI)
| Industry | F500 HQs | Revenue |
|---|---|---|
| Automotive Parts | 3 | $48B |
|
||
| Automotive | 2 | $372B |
|
||
| Chemicals | 1 | $45B |
|
||
| Automotive Retail | 1 | $29B |
|
||
| Healthcare / Medical Devices | 1 | $23B |
|
||
| Automotive Technology | 1 | $20B |
|
||
Price history
+143.0% since first listed8 events — show timeline
- 2026-06-09 Listed $425,000 MiRealSource-MiMLS
- 2026-06-09 Listed $425,000 SW Michigan MLS
- 2026-06-09 Listed $425,000 REALCOMP
- 2008-09-12 Sold (Public Records) $167,500 Public Records
- 2008-06-30 Sold (MLS) $167,500 REALCOMP
- 2008-06-30 Sold (MLS) $167,500 SW Michigan MLS
- 2008-05-01 Listed $174,900 REALCOMP
- 2008-05-01 Listed $174,900 SW Michigan MLS
Property tax history
+3.2%/yrLatest (2025): $3,123 · +2.6% YoY. Source: county tax records.
Cash-flow waterfall
monthlySold comps — $/sqft
last 12 mo · ≤1 miLoading sold comps…