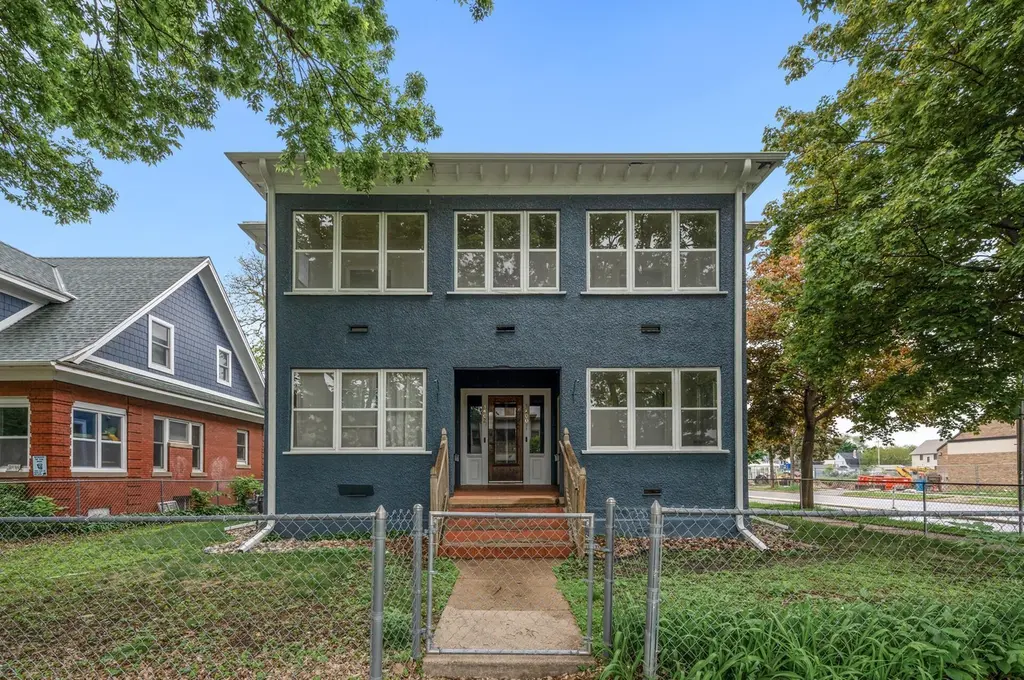
3400 Elliot Ave
Minneapolis, MN 55407
$500,000C-
16 bd · 16.0 ba ·
2,800 sqft ·
Built 1914
· MultiFamily
· Active
· 18 DOM
Cashflow @ list (25.0% down · 7.5%)
Estimated rent
$4,679/mo
Mortgage (P&I)
−$2,622
Tax + insurance
−$350
HOA
−$0
Vac / Maint / Mgmt
−$983
Net cashflow
$724/mo
Annual
$8,687/yr
Cap rate
8.03%
Cash-on-cash
6.21%
DSCR
1.28
1% rule
0.94%
Cash to close
$140,000
Investor read
- This is a 4 × 1-bed/1-bath units multifamily listed at $500k.
- At list price, monthly cash flow is $724 ($9k/yr) — positive. Per door: $181/mo.
- The deal already cash-flows at list — no discount required.
- To meet the 1% rule (rent ≥ 1% of price), the offer needs to be $468k (6.4% below list).
- It's been on market 18 days — a 2% lower offer ($492k) is reasonable based on typical stale-listing flexibility.
- Recommended offer: $468k (6.4% below list) — sets the bar for 1% rule.
- Local home prices are declining (-3.0%/yr); year-one equity from $3k of loan paydown is wiped out by about $15k of value loss. Plan a longer hold.
- Location reads 78/100 on livability (#110 in MN, #2,525 nationally) — a middle-class / working-renter tenant base. Strengths: amenities A+, commute A+, housing A+; Watch: cost of living C-, crime F.
- Minneapolis Public School District (urban): math 35% / reading 46% proficiency, ranked #217 of 301 in MN (top 72%) — families likely to look elsewhere, expect single-tenant / working-renter base with shorter leases.
- Zoned schools: Bancroft Elementary (math 17% / reading 27%, grade F, #732 of 857 statewide, top 88%, 369 students, 56% FRL); Sanford Middle (math 30% / reading 54%, grade D-, #131 of 258 statewide, top 53%, 738 students, 38% FRL); Roosevelt High (math 24%, 1,044 students, 59% FRL).
- Watch-outs: built in 1914 — expect roof / HVAC / electrical / plumbing capex.
- Market conditions: Rents rising fast (+4.3%/yr); 146 active listings in the ZIP; solid renter incomes; 4,651 units permitted in Hennepin County in 2024 (2,443 in 5+ unit buildings).
- Hennepin County population projected at +30% by 2050 — long-run rental-demand tailwind backs the buy-and-hold thesis.
- 5 sale attempts since 29y ago with the ask held roughly flat each time — persistent listings suggest the price (not the market) is what's stuck; bring a comps-based counter.
- Cap rate 8.0% vs local median 3.1% in Minneapolis — top-decile yield for the area; either an underpriced asset or a hidden risk that comps aren't pricing in. Stress-test before assuming the spread holds.
- At $4,679/mo this rent would consume 72% of the median local household income ($78k/yr) (locally 1583% of renters already pay >50% of income on rent) — very limited rent-growth headroom before tenants either downsize or default.
Questions for listing agent
- Can we see the unit-by-unit rent roll, current vacancy, and any below-market leases? What's the average tenancy length?
- What capital expenditures (roof, boiler, parking lot, exteriors) have been made in the last 5 years, and what's planned in the next 2?
- Built in 1914 — when were the roof, HVAC, electrical panel, plumbing, and water heater last replaced?
- Is there a deadline driving the sale (1031 exchange, divorce, estate, relocation)? That informs how much negotiation room exists.
- Crime grade is F in this area — have there been break-ins, vandalism, or insurance claims at this property in the last 3 years? What carrier currently insures it and at what premium?
- What's the average days-on-market for RENTAL listings here right now (not sales)? A rising rental-DOM trend means longer vacancies and softer asking-rent achievability than the comps imply.
- What's the recent tenant-quality profile in this submarket — average credit score on applications, eviction rate, late-payment / NSF rate, and stable-employment percentage? A property-management company in the area should have these aggregated.
- How much new apartment / multifamily construction is in the pipeline within 1–3 miles? Heavy new supply (>2% of stock underway) typically softens rents 12–24 months out; light construction supports rent growth.
CashFlowRE · CFR-WX4HNQ59ZNX5H6
· Data 21 h ago
cashflowre.app · 2026-05-29