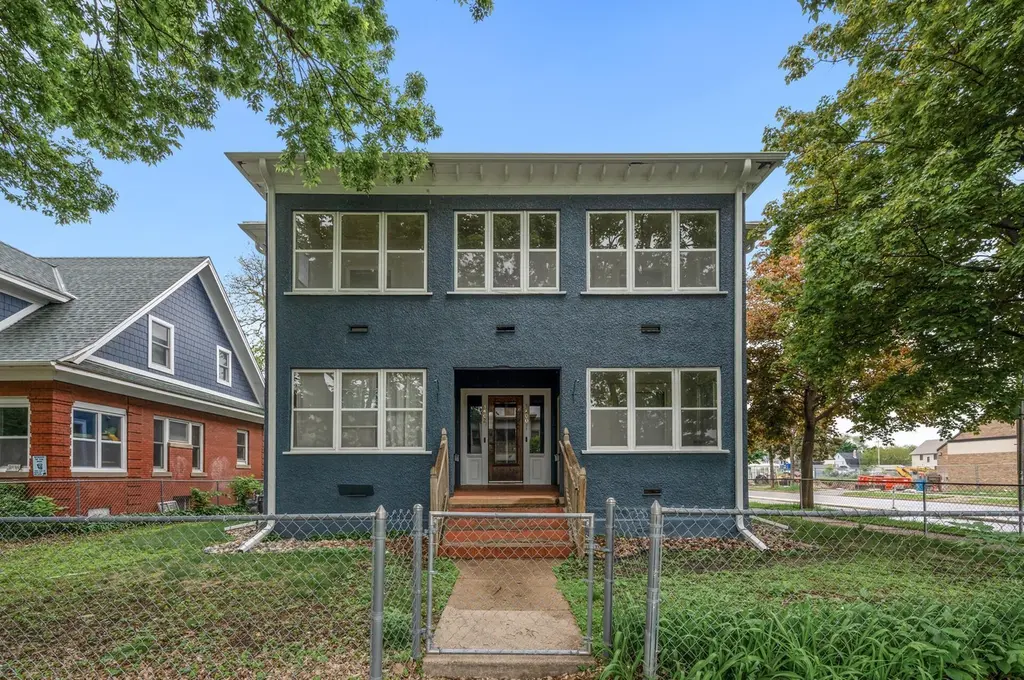
 Fourplex
3400 Elliot Ave · Minneapolis, MN
Flood risk 1/10 · Minimal
- FEMA flood zone
- X (unshaded)
- Chance of flooding over 30 yrs
- 0.0%
- Est. flood insurance / yr
- $473 – $860
Fire risk 1/10 · Minimal
- Est. fire insurance / yr
- $888 – $1,650
Heat risk 2/10 · Minimal
- Hot days now (above 100°F)
- 7 days/yr
- Hot days in 30 yrs
- 14 days/yr
Wind risk 2/10 · Minimal
- Chance of severe wind over 30 yrs
- —
Air-quality risk 2/10 · Minimal
- Unhealthy air days now
- 1 days/yr
- Unhealthy air days in 30 yrs
- 1 days/yr
Risk factors via First Street. Map © Google.
Why this score? — see what drove the C- grade
The composite is a weighted blend of 9 inputs, each scored 0–100. Each bar is that input's sub-score; the figure is the points it added to the 100-point composite (weight × sub-score).
- Cash flow +21.2/30.0
- ARV discount +7.5/15.0
- DSCR +6.8/10.0
- 1% rule +4.4/10.0
- Livability +3.9/5.0
- Rent growth +3.6/5.0
- Schools +3.5/10.0
- Condition / age +2.5/5.0
- Appreciation +0.0/10.0
$500,000
🖨 Deal sheet (PDF) 📄 Offer letter ✓ Due diligence
Multi-family units
County records classify this as Multi-Family (5+ Unit). Listing-text estimate: 4 units. estimate disagrees with records
5+ unit building — per-unit beds/baths from public records are typically unavailable; the breakdown below (if shown) is an estimate from the listing text.
Listing remarks MLS
Great opportunity. 1 bed units. Lots of character and original woodwork and built-ins. Nice corner lot. Convenient location near parks, bus-lines, school and other amenities. Sold As-Is.
Key facts
- 6,098 sq ft lot
- 2 garage spots
- Built 1914
Property features AI
Finance
- Other: Owner-occupied: No; Above grade finished area reported; Building total area reported
- Financial info: Gross income reported for the property: $64,380
- HOA & community: Community amenities include deck, patio, and porch
Exterior
- Parking: Detached 2-car garage
- Utilities: City water connected; City sewer connected; Natural gas
- Home design: Residential income property; Two levels; Main level finished area present; Entry on corner of E 34th St & Elliot Ave S
- Construction: Block foundation; Flat rubber roof; Foundation area noted
- Exterior features: Stucco exterior; Chain-link full fencing; Corner lot location; Paved streets and sidewalks
Interior
- Kitchen: Ranges in units; Refrigerators in units; Freezers in some units; One unit includes a dishwasher
- Bedrooms: Four total bedrooms across the building; Each unit is 1 bedroom
- Flooring: Hardwood floors in units
- Bathrooms: Four full bathrooms (one per unit)
- Heating & cooling: Forced air heating
- Interior features: Full unfinished basement with shared access and storage/locker; Hardwood floors in units; Porches and sun rooms in units
- Laundry & utility: Laundry located in the basement
Neighborhood map
What this means for you Summary
Snapshot
- This is a 4 × 1-bed/1-bath units multifamily listed at $500k.
Deal economics
- At list price, monthly cash flow is $724 ($9k/yr) — positive. Per door: $181/mo.
- The deal already cash-flows at list — no discount required.
- To meet the 1% rule (rent ≥ 1% of price), the offer needs to be $468k (6.4% below list).
- Recommended offer: $468k (6.4% below list) — sets the bar for 1% rule.
- Cap rate 8.0% vs local median 3.1% in Minneapolis — top-decile yield for the area; either an underpriced asset or a hidden risk that comps aren't pricing in. Stress-test before assuming the spread holds.
Location & tenants
- Location reads 78/100 on livability (#110 in MN, #2,525 nationally) — a middle-class / working-renter tenant base. Strengths: amenities A+, commute A+, housing A+; Watch: cost of living C-, crime F.
- Minneapolis Public School District (urban): math 35% / reading 46% proficiency, ranked #217 of 301 in MN (top 72%) — families likely to look elsewhere, expect single-tenant / working-renter base with shorter leases.
- Zoned schools: Bancroft Elementary (math 17% / reading 27%, grade F, #732 of 857 statewide, top 88%, 369 students, 56% FRL); Sanford Middle (math 30% / reading 54%, grade D-, #131 of 258 statewide, top 53%, 738 students, 38% FRL); Roosevelt High (math 24%, 1,044 students, 59% FRL).
- Market conditions: Rents rising fast (+4.3%/yr); 146 active listings in the ZIP; solid renter incomes; 4,651 units permitted in Hennepin County in 2024 (2,443 in 5+ unit buildings).
- At $4,679/mo this rent would consume 72% of the median local household income ($78k/yr) (locally 1583% of renters already pay >50% of income on rent) — very limited rent-growth headroom before tenants either downsize or default.
Forward outlook
- Local home prices are declining (-3.0%/yr); year-one equity from $3k of loan paydown is wiped out by about $15k of value loss. Plan a longer hold.
- Hennepin County population projected at +30% by 2050 — long-run rental-demand tailwind backs the buy-and-hold thesis.
Negotiation context
- It's been on market 18 days — a 2% lower offer ($492k) is reasonable based on typical stale-listing flexibility.
- 5 sale attempts since 29y ago with the ask held roughly flat each time — persistent listings suggest the price (not the market) is what's stuck; bring a comps-based counter.
Risks & watch-outs
- Watch-outs: built in 1914 — expect roof / HVAC / electrical / plumbing capex.
Questions for the listing agent
- Can we see the unit-by-unit rent roll, current vacancy, and any below-market leases? What's the average tenancy length?
- What capital expenditures (roof, boiler, parking lot, exteriors) have been made in the last 5 years, and what's planned in the next 2?
- Built in 1914 — when were the roof, HVAC, electrical panel, plumbing, and water heater last replaced?
- Is there a deadline driving the sale (1031 exchange, divorce, estate, relocation)? That informs how much negotiation room exists.
- Crime grade is F in this area — have there been break-ins, vandalism, or insurance claims at this property in the last 3 years? What carrier currently insures it and at what premium?
- What's the average days-on-market for RENTAL listings here right now (not sales)? A rising rental-DOM trend means longer vacancies and softer asking-rent achievability than the comps imply.
- What's the recent tenant-quality profile in this submarket — average credit score on applications, eviction rate, late-payment / NSF rate, and stable-employment percentage? A property-management company in the area should have these aggregated.
- How much new apartment / multifamily construction is in the pipeline within 1–3 miles? Heavy new supply (>2% of stock underway) typically softens rents 12–24 months out; light construction supports rent growth.
Investment metrics
- 1% rule
- 0.94% ✗
- Cap rate
- 8.03%
- Cash-on-cash
- 6.21%
- DSCR
- 1.28
- GRM
- 8.9
CMA / ARV
No comps found within radius.
Projected returns pro-forma
-3.0% appreciation · 4.3% rent growth · sell at horizon
- IRR
- -5.5%
- Equity multiple
- 0.79×
- Total profit
- $-28,939
- Equity at exit
- $74,552
- IRR
- 5.5%
- Equity multiple
- 1.42×
- Total profit
- $59,376
- Equity at exit
- $43,231
Cash invested: $140,000 (down + closing). Projections, not guarantees.
Landlord ↔ Tenant lean methodology
- Overall (CITY)
- 34 Tenant-Leaning
- State Minnesota
- 46 Balanced · D+2
- County
- — inherits STATE
- City Minneapolis
- 34 Tenant-Leaning · D+50
ZIP-level market 55407
- Rents YoY
- 4.3%
- Active inventory
- 146
- Price-to-rent
- 35.6×
Monthly cashflow live
- Estimated rent
- $4,679 high interval (Pro) →
- Mortgage (P&I)
- −$2,622
- Tax from tax record
- −$142 /mo · $1,705/yr
- Insurance
- −$208
- HOA
- −$0
- Vacancy / Maint / Mgmt
- −$983
- Net cashflow
- $724
Break-even live
Sensitivity live
| Price | -10% $1,007 | -5% $865 | +0% $724 | +5% $582 | +10% $441 |
|---|---|---|---|---|---|
| Rent | -10% $354 | -5% $539 | +0% $724 | +5% $909 | +10% $1,094 |
| Rate | -1.0pp $976 | -0.5pp $851 | base $724 | +0.5pp $594 | +1.0pp $463 |
4-unit breakdown (identical units grouped — click to expand)
| Units | Beds | Baths | Est. rent |
|---|---|---|---|
| 4× units | 1 | 1 | $4,680 |
| #1 | 1 | 1 | $1,170 |
| #2 | 1 | 1 | $1,170 |
| #3 | 1 | 1 | $1,170 |
| #4 | 1 | 1 | $1,170 |
| Total (4 units) | $4,679 | ||
UW: 25.0% down · 7.5% · 30yr · 1.5% tax · 5.0% vac · 8.0% maint · 8.0% mgmt
Financing live
Cash to close
- Down payment
- $125,000
- Closing costs
- $15,000
- Reserves months
- —
- Total cash needed
- —
Loan-product check · same deal, 3 products live
Conventional
25% down · 7.5% · 30yr
- Down + closing
- —
- Monthly P&I
- —
- Monthly cashflow
- —
- DSCR
- —
- Eligible?
- —
Personal DTI + credit; lowest rate.
DSCR
20% down · 8.5% · 30yr
- Down + closing
- —
- Monthly P&I
- —
- Monthly cashflow
- —
- DSCR
- —
- Eligible?
- —
No personal income docs; deal must DSCR.
Hard money
10% down · 12.0% · 12mo
- Down + closing
- —
- Monthly P&I
- —
- Monthly cashflow
- —
- DSCR
- —
- Eligible?
- —
Short-term bridge; refi at stabilization.
Listing history 14 events
-
2026-06-21days on market $500,000 Active 18 DOM
-
2026-06-18days on market $500,000 Active 15 DOM
-
2026-06-17days on market $500,000 Active 14 DOM
-
2026-06-16days on market $500,000 Active 13 DOM
-
2026-06-15days on market $500,000 Active 12 DOM
-
2026-06-13days on market $500,000 Active 10 DOM
-
2026-06-09days on market $500,000 Active 6 DOM
-
2026-06-08days on market $500,000 Active 5 DOM
-
2026-06-07days on market $500,000 Active 4 DOM
-
2026-06-04statusdays on market $500,000 Active 1 DOM
-
2026-06-03days on market $500,000 Coming Soon 5 DOM
-
2026-06-02days on market $500,000 Coming Soon 4 DOM
-
2026-06-01days on market $500,000 Coming Soon 3 DOM
-
2026-05-31days on market $500,000 Coming Soon 2 DOM
ⓘ Source: listings_history table (triggers on properties + properties_extension) + one-shot
backfill from property_details.listing_events for pre-trigger history.
Tax reassessment forecast MN · Partial reset (capped growth)
- Current annual tax
- $1,705 · $142/mo
- Projected year-2 tax
- $3,652 · $304/mo
- Expected delta
- +$1,948/yr (+$162/mo · 114.2%)
ⓘ Screening estimate from a state-policy table — verify with the county assessor before closing.
Climate risk First Street
- Flood 1/10 Low FEMA zone X (unshaded) · 0% chance over 30 yrs
- Wildfire 1/10 Low
- Heat 2/10 Low 7 d/yr ≥100°F today · 14 d/yr by 30 yrs out
- Wind 2/10 Low
- Air quality 2/10 Low 1 unhealthy d/yr today · 1 by 30 yrs out
Nearby sold comps map
Loading sold comps map…
Walkable amenities ~0.75 mi
Loading nearby amenities…
Taxation est. · year 1
- Rental income
- $56,148
- − Mortgage interest
- −$28,008
- − Property taxes
- −$1,705
- − Insurance
- −$2,500
- − Repairs & maintenance
- −$4,492
- − Management
- −$4,492
- − Depreciation
- −$14,545
- Taxable income
- $406
- Est. tax owed @ 24.0%
- −$98
- After-tax cash flow
- $8,590/yr
For passive investors: Depreciation is non-cash, so a rental often shows a tax loss while cash-flowing — sheltering income. Rental losses are passive: they offset passive income freely, and up to $25,000/yr can offset ordinary (W-2) income if you actively participate and your MAGI is under $100k (phasing out to $0 by $150k); unused losses carry forward. On sale, claimed depreciation is recaptured at up to 25%, and gains may owe capital-gains tax (a 1031 exchange can defer both). Figures are a year-1 estimate at your 24.0% rate — not tax advice; consult a CPA.
Schools (NCES district)
- District
- Minneapolis Public School District
- NCES district ID
- 2721240
- Math proficiency
- 35% ▼ -7.00%
- Reading proficiency
- 46% ▼ -1.00%
- Median HH income
- $50,521
- Composite
- 34.92/100
- National rank
- #5067
- State rank
- #217 of 301 in MN
Livability — Minneapolis
- Score
- 78/100
- State rank
- #110
- US rank
- #2525
Category grades
Schools grade is shown separately in the Schools card above.
Census & demographics
- Census place
- Minneapolis, MN
- County
- Hennepin County · 1,150,272 people
- City population
- 417,555
- Metro
- Minneapolis-St. Paul-Bloomington, MN-WI
- Population (ZIP)
- 37,667
- Household income
- $78,464
- Rent vs Own
- Severe rent burden
- 1583.0
Population outlook (Hennepin County) Hauer SSP2
- Today (2025)
- 1,405,227 people
- By 2030
- 1,492,650 · +6.2%
- By 2040
- 1,660,157 · +18.1%
- By 2050
- 1,823,498 · +29.8%
- By 2075
- 2,221,283 · +58.1%
- By 2100
- 2,509,976 · +78.6%
Race, ethnicity, and origin ACS 2023
- Neighborhood character
- Diverse neighborhood (Simpson 0.66)
- Race & ethnicity
- White 50% Hispanic / Latino 23% Black 18% Two or more races 10% Asian 2% Native American 2%
- Hispanic origin (detail)
- Mexican 15%
- Common ancestry
- Portuguese 8% Romanian 3% Lithuanian 2%
- Foreign-born
- 18% · Canada, Jamaica
- Languages at home
- 68% English-only · Spanish 20% Other Asian/Pacific 1%
Political lean MEDSL · Hennepin
- 2024 margin
- Solid D (+42.6) · D 70.2% · R 27.5% · Other 2.3%
- 2008→2024 swing
- +14.0pp toward D · 2008: 28.6pp · 2024: 42.6pp
- All cycles
- 2024: D+42.6 2020: D+43.2 2016: D+35.3 2012: D+27.1 2008: D+28.6
Not yet ingested
- Civics
- —
Market trends
- HPI YoY
- ▼ -211.97%
- Current HPI
- 292.0322
- Rent YoY
- ▲ 4.30%
- Metro
- Minneapolis-St. Paul-Bloomington, MN-WI
- State GDP YoY
- ▲ 2.41%
- F500 in state
- 34
Industry mix (Fortune 500 HQ in MN)
| Industry | F500 HQs | Revenue |
|---|---|---|
| Healthcare | 2 | $407B |
|
||
| Retail | 2 | $150B |
|
||
| Consumer Goods | 2 | $32B |
|
||
| Industrial Machinery | 2 | $6B |
|
||
| Agriculture | 1 | $40B |
|
||
| Healthcare / Medical Devices | 1 | $32B |
|
||
Price history
+525.8% since first listed21 events — show timeline
- 2026-05-29 Coming Soon $500,000 NORTHSTARMLS as Distributed by MLS Grid
- 2025-08-29 Listing Removed — NORTHSTARMLS as Distributed by MLS Grid
- 2025-07-31 Price Changed $540,000 NORTHSTARMLS as Distributed by MLS Grid
- 2025-06-04 Listed $499,900 NORTHSTARMLS as Distributed by MLS Grid
- 2025-05-30 Coming Soon — NORTHSTARMLS as Distributed by MLS Grid
- 2024-09-19 Sold (Public Records) $623,779 Public Records
- 2023-12-16 Rental Removed $1,100 APPFOLIO
- 2023-12-06 Price Changed $1,100 APPFOLIO
- 2023-12-02 Listed for Rent $800 APPFOLIO
- 2011-06-13 Sold (MLS) $66,000 NORTHSTARMLS as Distributed by MLS Grid
- 2011-04-06 Listing Removed — NORTHSTARMLS as Distributed by MLS Grid
- 2011-01-12 Listed $85,000 NORTHSTARMLS as Distributed by MLS Grid
- 2005-07-25 Sold (Public Records) $312,000 Public Records
- 2005-07-14 Sold (MLS) $312,000 NORTHSTARMLS as Distributed by MLS Grid
- 2005-06-10 Listing Removed — NORTHSTARMLS as Distributed by MLS Grid
- 2005-04-08 Listed $285,000 NORTHSTARMLS as Distributed by MLS Grid
- 1997-04-04 Sold (Public Records) $76,500 Public Records
- 1997-04-04 Sold (Public Records) $16,969 Public Records
- 1997-03-31 Sold (MLS) $76,500 NORTHSTARMLS as Distributed by MLS Grid
- 1997-03-10 Listing Removed — NORTHSTARMLS as Distributed by MLS Grid
- 1997-03-08 Listed $79,900 NORTHSTARMLS as Distributed by MLS Grid
Property tax history
-9.4%/yrLatest (2025): $1,705 · -61.9% YoY. Source: county tax records.
Cash-flow waterfall
monthlySold comps — $/sqft
last 12 mo · ≤1 miLoading sold comps…