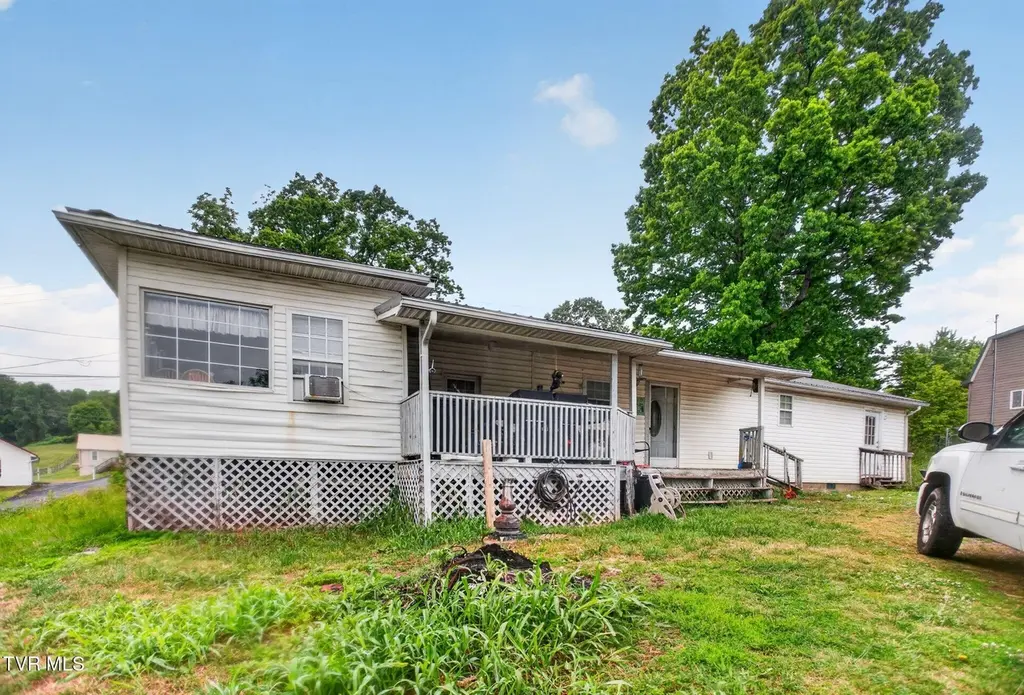
1201 Leeland Dr
Bloomingdale, TN 37660
$134,900B-
4 bd · 2.0 ba ·
1,840 sqft ·
Built 1943
· SingleFamily
· Active
· 19 DOM
Cashflow @ list (25.0% down · 7.5%)
Estimated rent
$1,936/mo
Mortgage (P&I)
−$707
Tax + insurance
−$121
HOA
−$0
Vac / Maint / Mgmt
−$406
Net cashflow
$701/mo
Annual
$8,407/yr
Cap rate
12.52%
Cash-on-cash
22.26%
DSCR
1.99
1% rule
1.43%
Cash to close
$37,772
Investor read
- This is a 4-bed/2.0-bath single-family listed at $135k.
- At list price, monthly cash flow is $701 ($8k/yr) — positive.
- The deal already cash-flows at list — no discount required.
- Meets the 1% rule at list price ($2k rent vs $135k).
- It's been on market 19 days — a 2% lower offer ($133k) is reasonable based on typical stale-listing flexibility.
- Recommended offer: $133k (1.5% below list) — sets the bar for market timing.
- Local home prices are declining (-3.0%/yr); year-one equity from $933 of loan paydown is wiped out by about $4k of value loss. Plan a longer hold.
- Location reads 56/100 on livability (#343 in TN) — a working-class tenant base; expect higher turnover. Strengths: cost of living A+, housing A+; Watch: employment D+, crime F, amenities F.
- Sullivan County (suburban): math 17% / reading 24% proficiency, ranked #109 of 139 in TN (top 78%) — low school quality limits family demand, transient renter base, plan for 1-2y turnover.
- Zoned schools: Ketron Elementary School (math 16% / reading 19%, grade F, #704 of 952 statewide, top 74%, 563 students, 0% FRL) — zoned schools average 0% FRL vs 45% district-wide (45 pts lower); this property's tenant base skews higher-income than the district average.
- Watch-outs: built in 1943 — expect roof / HVAC / electrical / plumbing capex.
- Market conditions: Rents rising fast (+8.0%/yr); 240 active listings in the ZIP; 3 comparable units currently listed for rent nearby; rentals at typical pace (median 15d on market — plan ~3-4 weeks tenant-placement turnaround); 453 units permitted in Sullivan County in 2024 (6 in 5+ unit buildings).
- Sullivan County population projected to shrink 5% by 2050 — rents likely to lag national; underwrite the cash flow, not the appreciation.
- Current owner paid $61k; list at $135k implies a 121% gain — meaningful room to come down on a strong offer.
- At projected returns (-3.0% appreciation + 8.0% rent growth), your $38k cash investment doubles in ~5 years — after that, you're playing with house money.
- Cap rate 12.5% vs local median 4.9% in Bloomingdale — top-decile yield for the area; either an underpriced asset or a hidden risk that comps aren't pricing in. Stress-test before assuming the spread holds.
- At $1,936/mo this rent would consume 47% of the median local household income ($49k/yr) (locally 1384% of renters already pay >50% of income on rent) — very limited rent-growth headroom before tenants either downsize or default.
Questions for listing agent
- Built in 1943 — when were the roof, HVAC, electrical panel, plumbing, and water heater last replaced?
- Is there a deadline driving the sale (1031 exchange, divorce, estate, relocation)? That informs how much negotiation room exists.
- Schools are F-rated, which usually means shorter tenancies and higher turnover. Who's the typical renter profile here, and what's been the actual vacancy rate?
- Crime grade is F in this area — have there been break-ins, vandalism, or insurance claims at this property in the last 3 years? What carrier currently insures it and at what premium?
- What's the average days-on-market for RENTAL listings here right now (not sales)? A rising rental-DOM trend means longer vacancies and softer asking-rent achievability than the comps imply.
- What's the recent tenant-quality profile in this submarket — average credit score on applications, eviction rate, late-payment / NSF rate, and stable-employment percentage? A property-management company in the area should have these aggregated.
- How much new for-sale + rental construction is in the pipeline within 1–3 miles? Heavy new supply typically softens prices + rents 12–24 months out; constrained supply supports both.
CashFlowRE · CFR-WY7ZKGE8XBX3J6
· Data 3 weeks ago
cashflowre.app · 2026-05-29