1201 Leeland Dr · Bloomingdale, TN
Flood risk 1/10 · Minimal
- FEMA flood zone
- X (unshaded)
- Chance of flooding over 30 yrs
- 0.0%
- Est. flood insurance / yr
- $507 – $1,088
Fire risk 3/10 · Minor
- Est. fire insurance / yr
- $949 – $1,763
Heat risk 4/10 · Minor
- Hot days now (above 100°F)
- 6 days/yr
- Hot days in 30 yrs
- 15 days/yr
Wind risk 2/10 · Minimal
- Chance of severe wind over 30 yrs
- —
Air-quality risk 2/10 · Minimal
- Unhealthy air days now
- 0 days/yr
- Unhealthy air days in 30 yrs
- 1 days/yr
Risk factors via First Street. Map © Google.
Why this score? — see what drove the B- grade
The composite is a weighted blend of 9 inputs, each scored 0–100. Each bar is that input's sub-score; the figure is the points it added to the 100-point composite (weight × sub-score).
- Cash flow +30.0/30.0
- DSCR +10.0/10.0
- 1% rule +9.3/10.0
- ARV discount +7.5/15.0
- Rent growth +4.5/5.0
- Livability +2.8/5.0
- Condition / age +2.5/5.0
- Schools +1.8/10.0
- Appreciation +0.0/10.0
$134,900
🖨 Deal sheet (PDF) 📄 Offer letter ✓ Due diligence
Listing remarks MLS
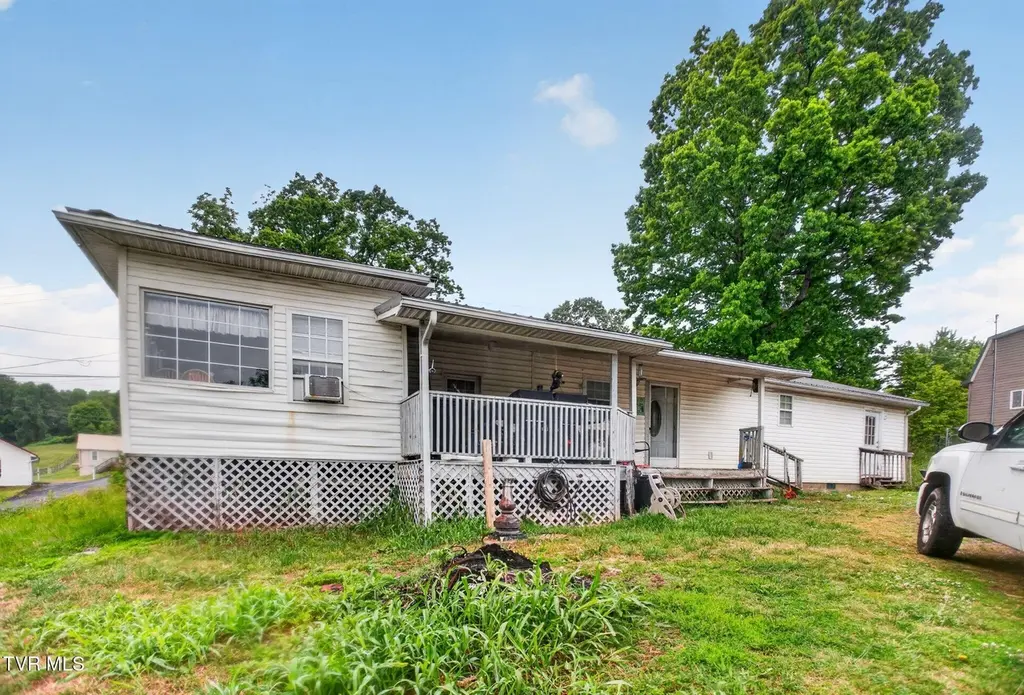
Investor special in Kingsport! This 4-bedroom, 2-bath single-family home features a brand-new metal roof installed within the last year. The property requires a full renovation and is being sold strictly as-is, with the seller making no repairs. Ideal for cash buyers seeking a value-add opportunity. After repair value is projected in the high $200Ks, making this a compelling project for investors looking to maximize returns. Bring your vision and transform this property into its full potential!
Key facts
- Metal roof
- Full renovation
- 0.45 acre lot
Tags
Neighborhood map
What this means for you Summary
Snapshot
- This is a 4-bed/2.0-bath single-family listed at $135k.
Deal economics
- At list price, monthly cash flow is $701 ($8k/yr) — positive.
- The deal already cash-flows at list — no discount required.
- Meets the 1% rule at list price ($2k rent vs $135k).
- Recommended offer: $133k (1.5% below list) — sets the bar for market timing.
- Cap rate 12.5% vs local median 4.9% in Bloomingdale — top-decile yield for the area; either an underpriced asset or a hidden risk that comps aren't pricing in. Stress-test before assuming the spread holds.
Location & tenants
- Location reads 56/100 on livability (#343 in TN) — a working-class tenant base; expect higher turnover. Strengths: cost of living A+, housing A+; Watch: employment D+, schools F, crime F.
- Sullivan County (suburban): math 17% / reading 24% proficiency, ranked #109 of 139 in TN (top 78%) — low school quality limits family demand, transient renter base, plan for 1-2y turnover.
- Market conditions: Rents rising fast (+8.0%/yr); 242 active listings in the ZIP; 3 comparable units currently listed for rent nearby; rentals at typical pace (median 15d on market — plan ~3-4 weeks tenant-placement turnaround); 453 units permitted in Sullivan County in 2024 (6 in 5+ unit buildings).
- At $1,936/mo this rent would consume 47% of the median local household income ($49k/yr) (locally 1384% of renters already pay >50% of income on rent) — very limited rent-growth headroom before tenants either downsize or default.
Forward outlook
- Local home prices are declining (-3.0%/yr); year-one equity from $933 of loan paydown is wiped out by about $4k of value loss. Plan a longer hold.
- Sullivan County population projected to shrink 5% by 2050 — rents likely to lag national; underwrite the cash flow, not the appreciation.
- At projected returns (-3.0% appreciation + 8.0% rent growth), your $38k cash investment doubles in ~5 years — after that, you're playing with house money.
Negotiation context
- It's been on market 19 days — a 2% lower offer ($133k) is reasonable based on typical stale-listing flexibility.
- 2 sale attempts since 12y ago; this cycle's ask has dropped $15k (10%) from the opening price — seller is motivated, your offer sets the floor, not the list.
- Current owner paid $61k; list at $135k implies a 121% gain — meaningful room to come down on a strong offer.
Risks & watch-outs
- Watch-outs: built in 1943 — expect roof / HVAC / electrical / plumbing capex.
Questions for the listing agent
- Built in 1943 — when were the roof, HVAC, electrical panel, plumbing, and water heater last replaced?
- Is there a deadline driving the sale (1031 exchange, divorce, estate, relocation)? That informs how much negotiation room exists.
- Schools are F-rated, which usually means shorter tenancies and higher turnover. Who's the typical renter profile here, and what's been the actual vacancy rate?
- Crime grade is F in this area — have there been break-ins, vandalism, or insurance claims at this property in the last 3 years? What carrier currently insures it and at what premium?
- What's the average days-on-market for RENTAL listings here right now (not sales)? A rising rental-DOM trend means longer vacancies and softer asking-rent achievability than the comps imply.
- What's the recent tenant-quality profile in this submarket — average credit score on applications, eviction rate, late-payment / NSF rate, and stable-employment percentage? A property-management company in the area should have these aggregated.
- How much new for-sale + rental construction is in the pipeline within 1–3 miles? Heavy new supply typically softens prices + rents 12–24 months out; constrained supply supports both.
Investment metrics
- 1% rule
- 1.43% ✓
- Cap rate
- 12.52%
- Cash-on-cash
- 22.26%
- DSCR
- 1.99
- GRM
- 5.8
CMA / ARV
- ARV (median comp)
- $289,552
- List price
- $134,900
- Delta
- -53.41%
- Verdict
- UNDERPRICED
- Comps
- 20 within 1.0 mi
Show comp detail 12 sales within ~0.75 mi
| Address | Dist | Beds/Ba | Sqft | Sold | Price | $/sf | Match |
|---|---|---|---|---|---|---|---|
| 224 Stone Edge Cir | 0.45mi | 4/3.0 | 1,860 (+1%) | 8mo | $310,000 | $167 | 67 |
| 248 Stone Edge Cir | 0.42mi | 3/2.5 (-1) | 1,798 (-2%) | 4mo | $324,900 | $181 | 66 |
| 101 Boulder Ct | 0.47mi | 3/2.0 (-1) | 1,918 (+4%) | 5mo | $380,000 | $198 | 62 |
| 176 Woodmont Ave | 0.73mi | 3/3.0 (-1) | 1,816 (-1%) | 0mo | $295,000 | $162 | 55 |
| 659 Gravely Rd | 0.69mi | 3/2.0 (-1) | 1,902 (+3%) | 6mo | $254,500 | $134 | 52 |
| 1168 Ridgecrest Ave | 0.64mi | 5/2.0 (+1) | 1,880 (+2%) | 14mo | $238,000 | $127 | 50 |
| 1029 Spring Valley Dr | 0.73mi | 3/2.0 (-1) | 1,716 (-7%) | 1mo | $270,000 | $157 | 49 |
| 237 Stone Edge Cir | 0.46mi | 5/3.0 (+1) | 1,978 (+8%) | 11mo | $381,900 | $193 | 48 |
| 1223 Wayne St | 0.59mi | 4/1.0 | 1,603 (-13%) | 2mo | $249,900 | $156 | 45 |
| 1154 Ridgecrest Ave | 0.60mi | 3/2.0 (-1) | 1,620 (-12%) | 12mo | $196,000 | $121 | 37 |
| 201 Thomas St | 0.50mi | 3/3.0 (-1) | 1,615 (-12%) | 15mo | $270,000 | $167 | 35 |
| 908 Spring Valley Dr | 0.75mi | 3/2.0 (-1) | 2,059 (+12%) | 11mo | $325,000 | $158 | 32 |
Match score weights: distance 35% · size 25% · config 20% · recency 20%. Top-matched comps best support the ARV.
Projected returns pro-forma
-3.0% appreciation · 7.95% rent growth · sell at horizon
- IRR
- 20.2%
- Equity multiple
- 1.87×
- Total profit
- $32,849
- Equity at exit
- $20,114
- IRR
- 31.4%
- Equity multiple
- 4.49×
- Total profit
- $131,941
- Equity at exit
- $11,664
Cash invested: $37,772 (down + closing). Projections, not guarantees.
Landlord ↔ Tenant lean methodology
- Overall (STATE)
- 87 Strongly Landlord-Friendly
- State Tennessee
- 87 Strongly Landlord-Friendly · R+13
- County
- — inherits STATE
- City
- — inherits STATE
ZIP-level market 37660
- Home prices YoY
- -24.2%
- Rents YoY
- 8.0%
- Active inventory
- 242
- Price-to-rent
- 5.8×
Monthly cashflow live
- Estimated rent
- $1,936 medium interval (Pro) →
- Mortgage (P&I)
- −$707
- Tax from tax record
- −$65 /mo · $779/yr
- Insurance
- −$56
- HOA
- −$0
- Vacancy / Maint / Mgmt
- −$406
- Net cashflow
- $701
Break-even live
Sensitivity live
| Price | -10% $777 | -5% $739 | +0% $701 | +5% $662 | +10% $624 |
|---|---|---|---|---|---|
| Rent | -10% $548 | -5% $624 | +0% $701 | +5% $777 | +10% $853 |
| Rate | -1.0pp $769 | -0.5pp $735 | base $701 | +0.5pp $666 | +1.0pp $630 |
UW: 25.0% down · 7.5% · 30yr · 1.5% tax · 5.0% vac · 8.0% maint · 8.0% mgmt
Financing live
Cash to close
- Down payment
- $33,725
- Closing costs
- $4,047
- Reserves months
- —
- Total cash needed
- —
Loan-product check · same deal, 3 products live
Conventional
25% down · 7.5% · 30yr
- Down + closing
- —
- Monthly P&I
- —
- Monthly cashflow
- —
- DSCR
- —
- Eligible?
- —
Personal DTI + credit; lowest rate.
DSCR
20% down · 8.5% · 30yr
- Down + closing
- —
- Monthly P&I
- —
- Monthly cashflow
- —
- DSCR
- —
- Eligible?
- —
No personal income docs; deal must DSCR.
Hard money
10% down · 12.0% · 12mo
- Down + closing
- —
- Monthly P&I
- —
- Monthly cashflow
- —
- DSCR
- —
- Eligible?
- —
Short-term bridge; refi at stabilization.
Rent comps 3 comps
| Address | Beds | Baths | Sqft | Rent | $/sqft | DOM | Units | Dist |
|---|---|---|---|---|---|---|---|---|
| 206 Hammond Ave Kingsport, TN | 3.0 | 1.0 | 1696 | $1,525 | $0.90 | 22d | 1 | 1.38mi |
| 109 W Wanola Ave Kingsport, TN | 3.0 | 2.0 | 1600 | $2,300 | $1.44 | 14d | 1 | 1.39mi |
| 455 W Sullivan St Kingsport, TN | 1.0–3.0 | 1.0–2.0 | 988 | $1,954 | $1.98 | 14d | 16 | 1.45mi |
Listing history 8 events
-
2026-05-30days on market $134,900 Active 19 DOM
-
2026-05-11$149,900 Active 499-char remark
Show marketing remark (499 chars)
Investor special in Kingsport! This 4-bedroom, 2-bath single-family home features a brand-new metal roof installed within the last year. The property requires a full renovation and is being sold strictly as-is, with the seller making no repairs. Ideal for cash buyers seeking a value-add opportunity. After repair value is projected in the high $200Ks, making this a compelling project for investors looking to maximize returns. Bring your vision and transform this property into its full potential!
-
2015-06-26soldstatus $61,000 389-char remark
Show marketing remark (389 chars)
2 houses for the price of one. Live in main house and rent out the singlewide. What a concept! Great investment property. Very spacious and all on one level. Closet space is abundant. A great buy. Right across the drive you have a singlewide mobile home as well. That has 2 bedrooms and 1 1/2 bath. Needs carpet, (old carpet pulled up and floors professionally sanitized. Great investment.
-
2015-06-24soldstatus $61,000
-
2014-03-11$69,900 389-char remark
Show marketing remark (389 chars)
2 houses for the price of one. Live in main house and rent out the singlewide. What a concept! Great investment property. Very spacious and all on one level. Closet space is abundant. A great buy. Right across the drive you have a singlewide mobile home as well. That has 2 bedrooms and 1 1/2 bath. Needs carpet, (old carpet pulled up and floors professionally sanitized. Great investment.
-
2000-06-29soldstatus $24,000
-
1999-09-21soldstatus $24,000
-
1993-09-16soldstatus $12,200
ⓘ Source: listings_history table (triggers on properties + properties_extension) + one-shot
backfill from property_details.listing_events for pre-trigger history.
Tax reassessment forecast TN · Resets to sale price
- Current annual tax
- $779 · $65/mo
- Projected year-2 tax
- $958 · $80/mo
- Expected delta
- +$179/yr (+$15/mo · 23.0%)
ⓘ Screening estimate from a state-policy table — verify with the county assessor before closing.
Climate risk First Street
- Flood 1/10 Low FEMA zone X (unshaded) · 0% chance over 30 yrs
- Wildfire 3/10 Moderate
- Heat 4/10 Moderate 6 d/yr ≥100°F today · 15 d/yr by 30 yrs out
- Wind 2/10 Low
- Air quality 2/10 Low 0 unhealthy d/yr today · 1 by 30 yrs out
Nearby sold comps map
Loading sold comps map…
Walkable amenities ~0.75 mi
Loading nearby amenities…
Taxation est. · year 1
- Rental income
- $23,227
- − Mortgage interest
- −$7,556
- − Property taxes
- −$779
- − Insurance
- −$674
- − Repairs & maintenance
- −$1,858
- − Management
- −$1,858
- − Depreciation
- −$3,924
- Taxable income
- $6,577
- Est. tax owed @ 24.0%
- −$1,578
- After-tax cash flow
- $6,829/yr
For passive investors: Depreciation is non-cash, so a rental often shows a tax loss while cash-flowing — sheltering income. Rental losses are passive: they offset passive income freely, and up to $25,000/yr can offset ordinary (W-2) income if you actively participate and your MAGI is under $100k (phasing out to $0 by $150k); unused losses carry forward. On sale, claimed depreciation is recaptured at up to 25%, and gains may owe capital-gains tax (a 1031 exchange can defer both). Figures are a year-1 estimate at your 24.0% rate — not tax advice; consult a CPA.
Schools (NCES district)
- District
- Sullivan County
- NCES district ID
- 4703990
- Math proficiency
- 17% ▼ -15.00%
- Reading proficiency
- 24% ▼ -10.00%
- Median HH income
- $43,263
- Composite
- 17.66/100
- National rank
- #9030
- State rank
- #109 of 139 in TN
Livability — Bloomingdale
- Score
- 56/100
- State rank
- #343
- US rank
- #22770
Category grades
Schools grade is shown separately in the Schools card above.
Census & demographics
- Census place
- Bloomingdale, TN
- County
- Sullivan County · 121,987 people
- Metro
- Kingsport-Bristol, TN-VA
- Population (ZIP)
- 40,996
- Household income
- $49,191
- Rent vs Own
- Severe rent burden
- 1384.0
Population outlook (Sullivan County) Hauer SSP2
- Today (2025)
- 157,030 people
- By 2030
- 156,415 · -0.4%
- By 2040
- 153,778 · -2.1%
- By 2050
- 149,018 · -5.1%
- By 2075
- 138,068 · -12.1%
- By 2100
- 119,927 · -23.6%
Race, ethnicity, and origin ACS 2023
- Neighborhood character
- Predominantly White (88%)
- Race & ethnicity
- White 88% Two or more races 4% Black 4% Hispanic / Latino 3%
- Common ancestry
- Serbian 3% Slovak 3% Italian 1%
- Foreign-born
- 2% · Canada
- Languages at home
- 98% English-only · Spanish 2%
Political lean MEDSL · Sullivan
- 2024 margin
- Solid R (+55.0) · D 22.0% · R 77.0% · Other 1.0%
- 2008→2024 swing
- -13.6pp toward R · 2008: -41.3pp · 2024: -55.0pp
- All cycles
- 2024: R+55.0 2020: R+51.9 2016: R+56.2 2012: R+47.2 2008: R+41.3
Not yet ingested
- Civics
- —
Market trends
- HPI YoY
- ▼ -80.93%
- Current HPI
- 252.9821
- Rent YoY
- ▲ 7.95%
- Metro
- Kingsport-Bristol, TN-VA
- State GDP YoY
- ▲ 2.78%
- F500 in state
- 22
Industry mix (Fortune 500 HQ in TN)
| Industry | F500 HQs | Revenue |
|---|---|---|
| Healthcare | 3 | $91B |
|
||
| Retail | 3 | $72B |
|
||
| Transportation / Logistics | 1 | $88B |
|
||
| Paper / Packaging | 1 | $19B |
|
||
| Insurance | 1 | $13B |
|
||
| Energy | 1 | $12B |
|
||
Price history
+1128.7% since first listed7 events — show timeline
- 2026-05-11 Listed $149,900 TVRMLS
- 2015-06-26 Sold (MLS) $61,000 TVRMLS
- 2015-06-24 Sold (Public Records) $61,000 Public Records
- 2014-03-11 Listed $69,900 TVRMLS
- 2000-06-29 Sold (Public Records) $24,000 Public Records
- 1999-09-21 Sold (Public Records) $24,000 Public Records
- 1993-09-16 Sold (Public Records) $12,200 Public Records
Property tax history
+5.9%/yrLatest (2025): $779 · +15.8% YoY. Source: county tax records.
Cash-flow waterfall
monthlySold comps — $/sqft
last 12 mo · ≤1 miLoading sold comps…