408 S Rusk St
De Leon, TX 76444
$10,000C-
2 bd · 1.0 ba ·
480 sqft ·
Built 1920
· SingleFamily
· Under Contract
Cashflow @ list (25.0% down · 7.5%)
Estimated rent
$802/mo
Mortgage (P&I)
−$52
Tax + insurance
−$12
HOA
−$0
Vac / Maint / Mgmt
−$168
Net cashflow
$569/mo
Annual
$6,829/yr
Cap rate
74.59%
Cash-on-cash
243.90%
DSCR
11.85
1% rule
8.02%
Cash to close
$2,800
Investor read
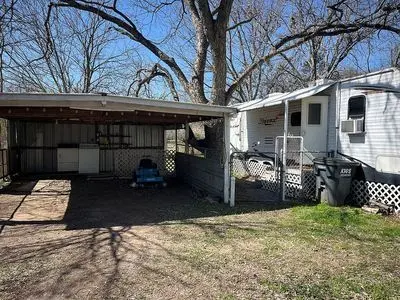
- This is a 2-bed/1.0-bath single-family listed at $10k.
- At list price, monthly cash flow is $569 ($7k/yr) — positive.
- The deal already cash-flows at list — no discount required.
- Meets the 1% rule at list price ($802 rent vs $10k).
- Only 0 days on market — expect competitive offers; lowballing is unlikely to land.
- In year one you build about $957 of equity ($69 loan paydown + $888 appreciation (8.9% local appreciation)).
- Location reads 64/100 on livability (#799 in TX) — a middle-class / working-renter tenant base. Strengths: cost of living A+, housing A+, crime B+; Watch: schools C-, health & safety D+, amenities F.
- De Leon ISD (rural): math 46% / reading 53% proficiency, ranked #207 of 826 in TX (top 25%) — families likely to look elsewhere, expect single-tenant / working-renter base with shorter leases.
- Watch-outs: built in 1920 — expect roof / HVAC / electrical / plumbing capex.
- Market conditions: 67 active listings in the ZIP; 4 units permitted in Comanche County in 2024 (0 in 5+ unit buildings).
- Comanche County population projected at -29% by 2050 — secular population decline; favor cash flow + early exit over multi-decade hold.
- 2 sale attempts since 10y ago with the ask held roughly flat each time — persistent listings suggest the price (not the market) is what's stuck; bring a comps-based counter.
- At projected returns (8.9% appreciation + 3.0% rent growth), your $3k cash investment doubles in ~1 year — after that, you're playing with house money.
- Climate carrying-cost: moderate wind risk, 26% chance of damaging wind over 30y; major wildfire risk; extreme-heat days projected 7→20/yr by 2055 (HVAC capex compounding) — expect insurance premiums to compound above CPI over the hold.
- Cap rate 74.6% vs local median 3.1% in De Leon — top-decile yield for the area; either an underpriced asset or a hidden risk that comps aren't pricing in. Stress-test before assuming the spread holds.
Questions for listing agent
- Built in 1920 — when were the roof, HVAC, electrical panel, plumbing, and water heater last replaced?
- Is there a deadline driving the sale (1031 exchange, divorce, estate, relocation)? That informs how much negotiation room exists.
- What's the average days-on-market for RENTAL listings here right now (not sales)? A rising rental-DOM trend means longer vacancies and softer asking-rent achievability than the comps imply.
- What's the recent tenant-quality profile in this submarket — average credit score on applications, eviction rate, late-payment / NSF rate, and stable-employment percentage? A property-management company in the area should have these aggregated.
- How much new for-sale + rental construction is in the pipeline within 1–3 miles? Heavy new supply typically softens prices + rents 12–24 months out; constrained supply supports both.
CashFlowRE · CFR-WZ2NQGBTZ17YNN
· Data 1 week ago
cashflowre.app · 2026-05-29