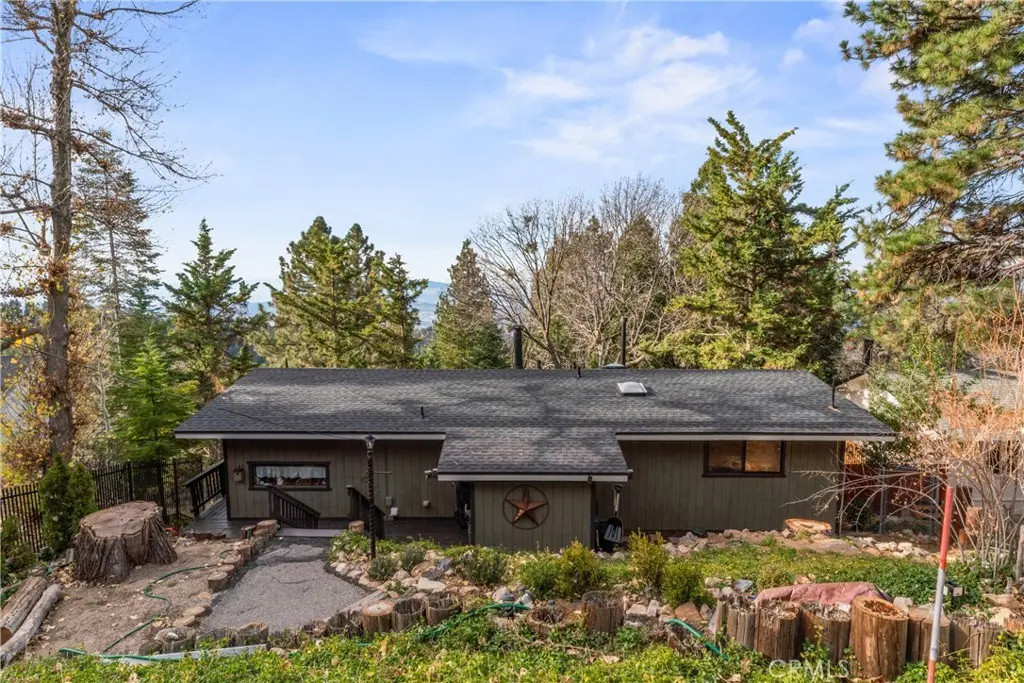
1944 Willow
Running Springs, CA 92382
$398,000D-
3 bd · 2.0 ba ·
1,666 sqft ·
Built 1962
· SingleFamily
· Active
· 175 DOM
Cashflow @ list (25.0% down · 7.5%)
Estimated rent
$2,646/mo
Mortgage (P&I)
−$2,087
Tax + insurance
−$370
HOA
−$0
Vac / Maint / Mgmt
−$556
Net cashflow
$-367/mo
Annual
$-4,402/yr
Cap rate
5.19%
Cash-on-cash
-3.95%
DSCR
0.82
1% rule
0.66%
Cash to close
$111,440
Investor read
- This is a 3-bed/2.0-bath single-family listed at $398k.
- At list price, monthly cash flow is $-367 ($-4k/yr) — negative.
- To cash-flow at today's rent, offer at most $333k (16.3% below list).
- To meet the 1% rule (rent ≥ 1% of price), the offer needs to be $265k (33.5% below list).
- It's been on market 175 days — a 12% lower offer ($350k) is reasonable based on typical stale-listing flexibility.
- Recommended offer: $265k (33.5% below list) — sets the bar for 1% rule.
- Local home prices are declining (-3.0%/yr); year-one equity from $3k of loan paydown is wiped out by about $12k of value loss. Plan a longer hold.
- Location reads 66/100 on livability (#333 in CA) — a middle-class / working-renter tenant base. Strengths: housing A+, employment A-; Watch: crime C-, schools D+, amenities F.
- Rim Of The World Unified (town): math 13% / reading 34% proficiency, ranked #415 of 517 in CA (top 80%) — low school quality limits family demand, transient renter base, plan for 1-2y turnover.
- Market conditions: 180 active listings in the ZIP; 4 comparable units currently listed for rent nearby; rentals at typical pace (median 19d on market — plan ~3-4 weeks tenant-placement turnaround); solid renter incomes; 5,458 units permitted in San Bernardino County in 2024 (1,500 in 5+ unit buildings).
- San Bernardino County population projected at +15% by 2050 — modest demand growth; plan on rents tracking national, not racing it.
- 6 sale attempts since 22y ago with the ask held roughly flat each time — persistent listings suggest the price (not the market) is what's stuck; bring a comps-based counter.
- Current owner paid $150k; list at $398k implies a 165% gain — meaningful room to come down on a strong offer.
- Climate carrying-cost: severe wildfire risk — expect insurance premiums to compound above CPI over the hold.
- Cap rate 5.2% vs local median 3.9% in Running Springs — top-decile yield for the area; either an underpriced asset or a hidden risk that comps aren't pricing in. Stress-test before assuming the spread holds.
- This rent runs 39% of the median local income ($81k/yr) — at the standard rent-burdened threshold; future hikes will face affordability resistance.
Questions for listing agent
- What do current leases actually rent for vs. the listed asking? Can we see a recent rent roll and the last 12 months of T-12 income?
- It's been on market 175 days. Have you received any prior offers? Is the seller open to a 34% concession, seller financing, or rate buy-down credit?
- Built in 1962 — when were the roof, HVAC, electrical panel, plumbing, and water heater last replaced?
- Why hasn't it sold? Are there any deal-killer items the seller is aware of (foundation, flood, title, zoning, code violations)?
- Is there a deadline driving the sale (1031 exchange, divorce, estate, relocation)? That informs how much negotiation room exists.
- Schools are D-rated, which usually means shorter tenancies and higher turnover. Who's the typical renter profile here, and what's been the actual vacancy rate?
- The area grade is low — what's the realistic commute time and amenity access for the typical tenant pool here? Any planned neighborhood developments (good or bad) we should know about?
- What's the average days-on-market for RENTAL listings here right now (not sales)? A rising rental-DOM trend means longer vacancies and softer asking-rent achievability than the comps imply.
CashFlowRE · CFR-X08SCR9HCPJA9M
· Data 2 days ago
cashflowre.app · 2026-05-29