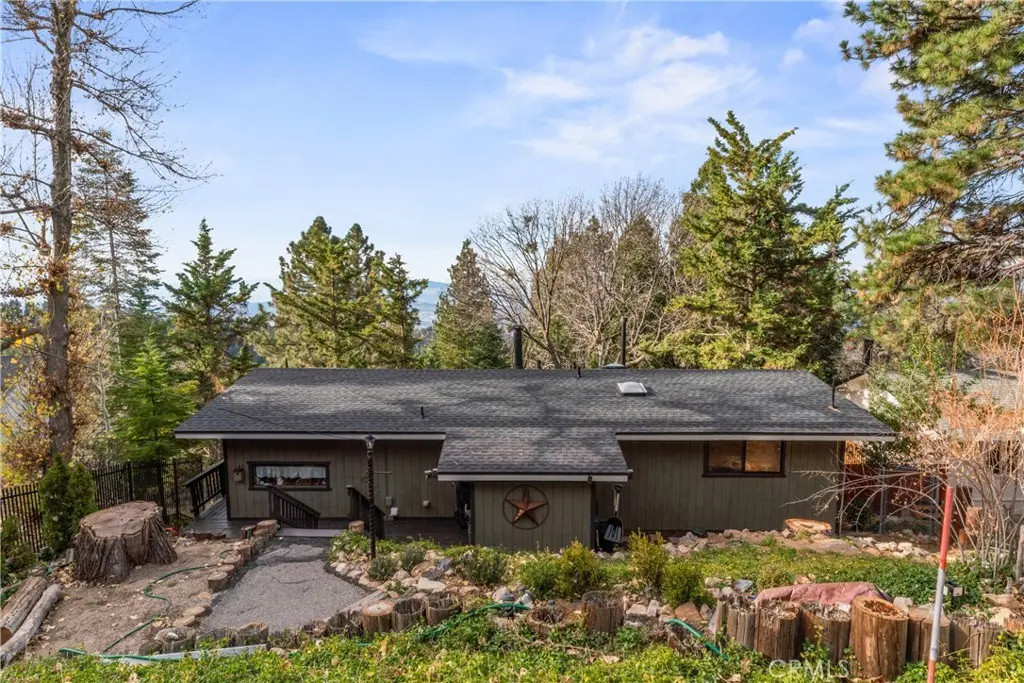
1944 Willow · Running Springs, CA
Flood risk 1/10 · Minimal
- FEMA flood zone
- D
- Chance of flooding over 30 yrs
- 0.0%
- Est. flood insurance / yr
- $400 – $4,352
Fire risk 8/10 · Major
- Est. fire insurance / yr
- $659 – $1,223
Heat risk 2/10 · Minimal
- Hot days now (above threshold)
- —
- Hot days in 30 yrs
- —
Wind risk 1/10 · Minimal
- Chance of severe wind over 30 yrs
- —
Air-quality risk 10/10 · Severe
- Unhealthy air days now
- 35 days/yr
- Unhealthy air days in 30 yrs
- 45 days/yr
Risk factors via First Street. Map © Google.
Why this score? — see what drove the D- grade
The composite is a weighted blend of 9 inputs, each scored 0–100. Each bar is that input's sub-score; the figure is the points it added to the 100-point composite (weight × sub-score).
- ARV discount +15.0/15.0
- Cash flow +8.3/30.0
- Livability +3.3/5.0
- Rent growth +2.5/5.0
- Condition / age +2.5/5.0
- DSCR +2.2/10.0
- Schools +2.1/10.0
- 1% rule +1.6/10.0
- Appreciation +0.0/10.0
$398,000
🖨 Deal sheet 📄 Offer letter ✓ Due diligence
Listing remarks MLS
BEAUTIFUL FAMILY HOME WITH A BREATHTAKING VIEW !!! WHEN ENTERING THIS HOME YOU WILL SEE A WALL OF WINDOWS. VERY MUCH SHOW STOPPING! THE LIVING ROOM BLENDS INTO AN EATING AREA, THEN KITHEN. THERE ARE TWO BEDROOMS ON EACH FLOOR. THE MASTER BEDROOM HAS A HUGE CLOSET AREA. A SPA IS ON THE LOWER DECK ALONG WITH AN ENCLOSURE WITH A GENERATOR. THE ROOF IS ONLY 2 YEARS OLD. THE REDWOOD DECKS ARE NEW. SO, WHEN YOU ARE SITTING IN THE LIVING ROOM IN FRONT OF THE WOOD BURNING STOVE AND ENJOYING THE PANORAMIC VIEW, YOU KNOW YOU'RE HOME.
Key facts
- Huge closet area
- Wall of windows
- Wood burning stove
Tags
Neighborhood map
What this means for you Summary
Snapshot
- This is a 3-bed/2.0-bath single-family listed at $398k.
Deal economics
- At list price, monthly cash flow is $-367 ($-4k/yr) — negative.
- To cash-flow at today's rent, offer at most $333k (16.3% below list).
- To meet the 1% rule (rent ≥ 1% of price), the offer needs to be $265k (33.5% below list).
- Recommended offer: $265k (33.5% below list) — sets the bar for 1% rule.
- Cap rate 5.2% vs local median 3.9% in Running Springs — top-decile yield for the area; either an underpriced asset or a hidden risk that comps aren't pricing in. Stress-test before assuming the spread holds.
Location & tenants
- Location reads 66/100 on livability (#333 in CA) — a middle-class / working-renter tenant base. Strengths: housing A+, employment A-; Watch: crime C-, schools D+, amenities F.
- Rim Of The World Unified (town): math 13% / reading 34% proficiency, ranked #415 of 517 in CA (top 80%) — low school quality limits family demand, transient renter base, plan for 1-2y turnover.
- Market conditions: 180 active listings in the ZIP; 4 comparable units currently listed for rent nearby; rentals at typical pace (median 18d on market — plan ~3-4 weeks tenant-placement turnaround); solid renter incomes; 5,458 units permitted in San Bernardino County in 2024 (1,500 in 5+ unit buildings).
- This rent runs 39% of the median local income ($81k/yr) — at the standard rent-burdened threshold; future hikes will face affordability resistance.
Forward outlook
- Local home prices are declining (-3.0%/yr); year-one equity from $3k of loan paydown is wiped out by about $12k of value loss. Plan a longer hold.
- San Bernardino County population projected at +15% by 2050 — modest demand growth; plan on rents tracking national, not racing it.
Negotiation context
- It's been on market 175 days — a 12% lower offer ($350k) is reasonable based on typical stale-listing flexibility.
- 6 sale attempts since 22y ago with the ask held roughly flat each time — persistent listings suggest the price (not the market) is what's stuck; bring a comps-based counter.
- Current owner paid $150k; list at $398k implies a 165% gain — meaningful room to come down on a strong offer.
Risks & watch-outs
- Climate carrying-cost: severe wildfire risk — expect insurance premiums to compound above CPI over the hold.
Questions for the listing agent
- What do current leases actually rent for vs. the listed asking? Can we see a recent rent roll and the last 12 months of T-12 income?
- It's been on market 175 days. Have you received any prior offers? Is the seller open to a 34% concession, seller financing, or rate buy-down credit?
- Built in 1962 — when were the roof, HVAC, electrical panel, plumbing, and water heater last replaced?
- Why hasn't it sold? Are there any deal-killer items the seller is aware of (foundation, flood, title, zoning, code violations)?
- Is there a deadline driving the sale (1031 exchange, divorce, estate, relocation)? That informs how much negotiation room exists.
- Schools are D-rated, which usually means shorter tenancies and higher turnover. Who's the typical renter profile here, and what's been the actual vacancy rate?
- The area grade is low — what's the realistic commute time and amenity access for the typical tenant pool here? Any planned neighborhood developments (good or bad) we should know about?
- What's the average days-on-market for RENTAL listings here right now (not sales)? A rising rental-DOM trend means longer vacancies and softer asking-rent achievability than the comps imply.
- What's the recent tenant-quality profile in this submarket — average credit score on applications, eviction rate, late-payment / NSF rate, and stable-employment percentage? A property-management company in the area should have these aggregated.
- How much new for-sale + rental construction is in the pipeline within 1–3 miles? Heavy new supply typically softens prices + rents 12–24 months out; constrained supply supports both.
Investment metrics
- 1% rule
- 0.66% ✗
- Cap rate
- 5.19%
- Cash-on-cash
- -3.95%
- DSCR
- 0.82
- GRM
- 12.5
CMA / ARV
- ARV (median comp)
- $478,872
- List price
- $398,000
- Delta
- -16.89%
- Verdict
- UNDERPRICED
- Comps
- 20 within 1.0 mi
Show comp detail 12 sales within ~0.75 mi
| Address | Dist | Beds/Ba | Sqft | Sold | Price | $/sf | Match |
|---|---|---|---|---|---|---|---|
| 2012 Poplar | 0.08mi | 3/2.0 | 1,660 (-0%) | 1mo | $499,000 | $301 | 95 |
| 30941 Glen Oak | 0.37mi | 3/2.0 | 1,725 (+4%) | 2mo | $420,000 | $243 | 75 |
| 30980 Nob Hl | 0.26mi | 3/3.0 | 1,593 (-4%) | 4mo | $470,000 | $295 | 73 |
| 30881 Live Oak | 0.41mi | 3/2.0 | 1,788 (+7%) | 2mo | $574,000 | $321 | 67 |
| 1823 Nob Hill Dr | 0.17mi | 4/2.5 (+1) | 1,860 (+12%) | 4mo | $455,000 | $245 | 63 |
| 31047 Summit | 0.52mi | 4/2.0 (+1) | 1,593 (-4%) | 3mo | $389,000 | $244 | 61 |
| 2313 Spring Oak | 0.68mi | 3/2.5 | 1,776 (+7%) | 5mo | $490,000 | $276 | 51 |
| 31120 Mountain Oak | 0.51mi | 3/3.0 | 1,867 (+12%) | 2mo | $385,000 | $206 | 50 |
| 30919 All View Dr | 0.54mi | 4/3.0 (+1) | 1,788 (+7%) | 5mo | $420,000 | $235 | 49 |
| 30580 Live Oak | 0.71mi | 3/2.0 | 1,530 (-8%) | 5mo | $375,000 | $245 | 49 |
| 31308 Firwood | 0.61mi | 3/2.0 | 1,480 (-11%) | 5mo | $399,000 | $270 | 49 |
| 31124 All View Dr | 0.66mi | 3/1.0 | 1,440 (-14%) | 3mo | $362,000 | $251 | 40 |
Match score weights: distance 35% · size 25% · config 20% · recency 20%. Top-matched comps best support the ARV.
Projected returns pro-forma
-3.0% appreciation · 3.0% rent growth · sell at horizon
- IRR
- -23.0%
- Equity multiple
- 0.21×
- Total profit
- $-87,999
- Equity at exit
- $59,343
- IRR
- -17.6%
- Equity multiple
- 0.04×
- Total profit
- $-107,284
- Equity at exit
- $34,412
Cash invested: $111,440 (down + closing). Projections, not guarantees.
Landlord ↔ Tenant lean methodology
- Overall (STATE)
- 18 Strongly Tenant-Friendly
- State California
- 18 Strongly Tenant-Friendly · D+13
- County
- — inherits STATE
- City
- — inherits STATE
ZIP-level market 92382
- Active inventory
- 180
- Price-to-rent
- 12.5×
Monthly cashflow live
- Estimated rent
- $2,646 medium interval (Pro) →
- Mortgage (P&I)
- −$2,087
- Tax from tax record
- −$204 /mo · $2,453/yr
- Insurance
- −$166
- HOA
- −$0
- Vacancy / Maint / Mgmt
- −$556
- Net cashflow
- $-367
Break-even live
UW: 25.0% down · 7.5% · 30yr · 1.5% tax · 5.0% vac · 8.0% maint · 8.0% mgmt
Financing live
Cash to close
- Down payment
- $99,500
- Closing costs
- $11,940
- Reserves months
- —
- Total cash needed
- —
Loan-product check · same deal, 3 products live
Conventional
25% down · 7.5% · 30yr
- Down + closing
- —
- Monthly P&I
- —
- Monthly cashflow
- —
- DSCR
- —
- Eligible?
- —
Personal DTI + credit; lowest rate.
DSCR
20% down · 8.5% · 30yr
- Down + closing
- —
- Monthly P&I
- —
- Monthly cashflow
- —
- DSCR
- —
- Eligible?
- —
No personal income docs; deal must DSCR.
Hard money
10% down · 12.0% · 12mo
- Down + closing
- —
- Monthly P&I
- —
- Monthly cashflow
- —
- DSCR
- —
- Eligible?
- —
Short-term bridge; refi at stabilization.
Rent comps 4 comps
| Address | Beds | Baths | Sqft | Rent | $/sqft | DOM | Units | Dist |
|---|---|---|---|---|---|---|---|---|
| 31393 Lightfoot Way Running Springs, CA | 2.0 | 3.0 | 1354 | $2,600 | $1.92 | 14d | 1 | 1.05mi |
| 4 Winding Way Running Springs, CA | 3.0 | 2.5 | 1822 | $2,900 | $1.59 | 4d | 1 | 1.17mi |
| 31808 Luring Pines Dr Running Springs, CA | 3.0 | 2.0 | 1140 | $2,400 | $2.11 | 18d | 1 | 1.39mi |
| 31938 Encina Way Running Springs, CA | 3.0 | 2.0 | 1320 | $2,650 | $2.01 | 43d | 1 | 1.49mi |
Listing history 31 events
-
2026-06-18days on market $398,000 Active 175 DOM
-
2026-06-17days on market $398,000 Active 174 DOM
-
2026-06-16days on market $398,000 Active 173 DOM
-
2026-06-15days on market $398,000 Active 172 DOM
-
2026-06-13days on market $398,000 Active 170 DOM
-
2026-06-13days on market $398,000 Active 169 DOM
-
2026-06-09days on market $398,000 Active 166 DOM
-
2026-06-08days on market $398,000 Active 165 DOM
-
2026-06-07days on market $398,000 Active 164 DOM
-
2026-06-04days on market $398,000 Active 161 DOM
-
2026-06-03days on market $398,000 Active 160 DOM
-
2026-06-02days on market $398,000 Active 159 DOM
-
2026-06-01days on market $398,000 Active 158 DOM
-
2026-05-31days on market $398,000 Active 157 DOM
-
2026-03-30price $398,000 533-char remark
Show marketing remark (533 chars)
BEAUTIFUL FAMILY HOME WITH A BREATHTAKING VIEW !!! WHEN ENTERING THIS HOME YOU WILL SEE A WALL OF WINDOWS. VERY MUCH SHOW STOPPING! THE LIVING ROOM BLENDS INTO AN EATING AREA, THEN KITHEN. THERE ARE TWO BEDROOMS ON EACH FLOOR. THE MASTER BEDROOM HAS A HUGE CLOSET AREA. A SPA IS ON THE LOWER DECK ALONG WITH AN ENCLOSURE WITH A GENERATOR. THE ROOF IS ONLY 2 YEARS OLD. THE REDWOOD DECKS ARE NEW. SO, WHEN YOU ARE SITTING IN THE LIVING ROOM IN FRONT OF THE WOOD BURNING STOVE AND ENJOYING THE PANORAMIC VIEW, YOU KNOW YOU'RE HOME.
-
2025-12-25$410,000 Active 533-char remark
Show marketing remark (533 chars)
BEAUTIFUL FAMILY HOME WITH A BREATHTAKING VIEW !!! WHEN ENTERING THIS HOME YOU WILL SEE A WALL OF WINDOWS. VERY MUCH SHOW STOPPING! THE LIVING ROOM BLENDS INTO AN EATING AREA, THEN KITHEN. THERE ARE TWO BEDROOMS ON EACH FLOOR. THE MASTER BEDROOM HAS A HUGE CLOSET AREA. A SPA IS ON THE LOWER DECK ALONG WITH AN ENCLOSURE WITH A GENERATOR. THE ROOF IS ONLY 2 YEARS OLD. THE REDWOOD DECKS ARE NEW. SO, WHEN YOU ARE SITTING IN THE LIVING ROOM IN FRONT OF THE WOOD BURNING STOVE AND ENJOYING THE PANORAMIC VIEW, YOU KNOW YOU'RE HOME.
-
2022-08-23historical
-
2011-07-11soldstatus $150,000
-
2010-12-13historical
-
2010-12-07$169,000 Active
-
2010-11-24$169,000
-
2007-04-17soldstatus $230,000
-
2007-04-17soldstatus $230,000 Closed Sale
-
2007-04-17soldstatus $230,000
-
2007-01-27historical
-
2007-01-27$275,000
-
2006-09-23$275,000
-
2005-03-20soldstatus $225,000
-
2004-10-29$225,000
-
1990-03-26soldstatus $85,000
-
1985-12-18soldstatus $89,500
ⓘ Source: listings_history table (triggers on properties + properties_extension) + one-shot
backfill from property_details.listing_events for pre-trigger history.
Tax reassessment forecast CA · Resets to sale price
- Current annual tax
- $2,453 · $204/mo
- Projected year-2 tax
- $3,025 · $252/mo
- Expected delta
- +$571/yr (+$48/mo · 23.3%)
ⓘ Screening estimate from a state-policy table — verify with the county assessor before closing.
Climate risk First Street
- Flood 1/10 Low FEMA zone D · 0% chance over 30 yrs
- Wildfire 8/10 Severe
- Heat 2/10 Low
- Wind 1/10 Low
- Air quality 10/10 Extreme 35 unhealthy d/yr today · 45 by 30 yrs out
Nearby sold comps map
Loading sold comps map…
Walkable amenities ~0.75 mi
Loading nearby amenities…
Taxation est. · year 1
- Rental income
- $31,756
- − Mortgage interest
- −$22,294
- − Property taxes
- −$2,453
- − Insurance
- −$1,990
- − Repairs & maintenance
- −$2,540
- − Management
- −$2,540
- − Depreciation
- −$11,578
- Taxable loss
- −$11,641
- Est. tax savings @ 24.0%
- +$2,794
- After-tax cash flow
- $-1,608/yr
For passive investors: Depreciation is non-cash, so a rental often shows a tax loss while cash-flowing — sheltering income. Rental losses are passive: they offset passive income freely, and up to $25,000/yr can offset ordinary (W-2) income if you actively participate and your MAGI is under $100k (phasing out to $0 by $150k); unused losses carry forward. On sale, claimed depreciation is recaptured at up to 25%, and gains may owe capital-gains tax (a 1031 exchange can defer both). Figures are a year-1 estimate at your 24.0% rate — not tax advice; consult a CPA.
Schools (NCES district)
- District
- Rim Of The World Unified
- NCES district ID
- 0632610
- Math proficiency
- 13% ▼ -10.00%
- Reading proficiency
- 34% ▼ -7.00%
- Median HH income
- $55,860
- Composite
- 21.29/100
- National rank
- #8389
- State rank
- #415 of 517 in CA
Livability — Running Springs
- Score
- 66/100
- State rank
- #333
- US rank
- #11396
Category grades
Schools grade is shown separately in the Schools card above.
Census & demographics
- Census place
- Running Springs, CA
- County
- San Bernardino County · 2,030,291 people
- City population
- 5,215
- Metro
- Riverside-San Bernardino-Ontario, CA
- Population (ZIP)
- 5,215
- Household income
- $81,493
- Rent vs Own
- Severe rent burden
- 255.0
Population outlook (San Bernardino County) Hauer SSP2
- Today (2025)
- 2,300,329 people
- By 2030
- 2,378,907 · +3.4%
- By 2040
- 2,523,137 · +9.7%
- By 2050
- 2,642,388 · +14.9%
- By 2075
- 2,880,769 · +25.2%
- By 2100
- 2,909,436 · +26.5%
Race, ethnicity, and origin ACS 2023
- Neighborhood character
- Predominantly White (70%)
- Race & ethnicity
- White 70% Hispanic / Latino 21% Two or more races 17% Asian 3% Native American 1%
- Hispanic origin (detail)
- Mexican 18%
- Common ancestry
- Iranian 2% Slovak 2% Scotch-Irish 2%
- Foreign-born
- 5% · Canada, South Korea
- Languages at home
- 90% English-only · Spanish 6% Tagalog/Filipino 3% French/Haitian/Cajun 1%
Political lean MEDSL · San Bernardino
- 2024 margin
- Toss-up / Even · D 47.5% · R 49.7% · Other 2.8%
- 2008→2024 swing
- -8.5pp toward R · 2008: 6.3pp · 2024: -2.1pp
- All cycles
- 2024: R+2.1 2020: D+10.7 2016: D+9.8 2012: D+5.4 2008: D+6.3
Not yet ingested
- Civics
- —
Market trends
- HPI YoY
- ▼ -263.08%
- Current HPI
- 341.4318
- Rent YoY
- —
- Metro
- Riverside-San Bernardino-Ontario, CA
- State GDP YoY
- ▲ 3.21%
- F500 in state
- 116
Industry mix (Fortune 500 HQ in CA)
| Industry | F500 HQs | Revenue |
|---|---|---|
| Technology | 27 | $1,492B |
|
||
| Financial Services | 3 | $174B |
|
||
| Retail | 3 | $44B |
|
||
| Insurance | 3 | $26B |
|
||
| Media / Entertainment | 2 | $115B |
|
||
| Pharmaceuticals / Biotech | 2 | $62B |
|
||
Price history
+344.7% since first listed17 events — show timeline
- 2026-03-30 Price Changed $398,000 CRMLS
- 2025-12-25 Listed $410,000 CRMLS
- 2022-08-23 Listing Removed — CRMLS
- 2011-07-11 Sold (Public Records) $150,000 Public Records
- 2010-12-13 Listing Removed — CRMLS
- 2010-12-07 Listed $169,000 CRMLS
- 2010-11-24 Listed $169,000 CRMLS
- 2007-04-17 Sold (Public Records) $230,000 Public Records
- 2007-04-17 Sold (MLS) $230,000 CRMLS
- 2007-04-17 Sold (MLS) $230,000 CRMLS
- 2007-01-27 Listing Removed — CRMLS
- 2007-01-27 Listed $275,000 CRMLS
- 2006-09-23 Listed $275,000 CRMLS
- 2005-03-20 Sold (MLS) $225,000 CRMLS
- 2004-10-29 Listed $225,000 CRMLS
- 1990-03-26 Sold (Public Records) $85,000 Public Records
- 1985-12-18 Sold (Public Records) $89,500 Public Records
Property tax history
-0.8%/yrLatest (2025): $2,453 · +3.5% YoY. Source: county tax records.
Cash-flow waterfall
monthlySold comps — $/sqft
last 12 mo · ≤1 miLoading sold comps…