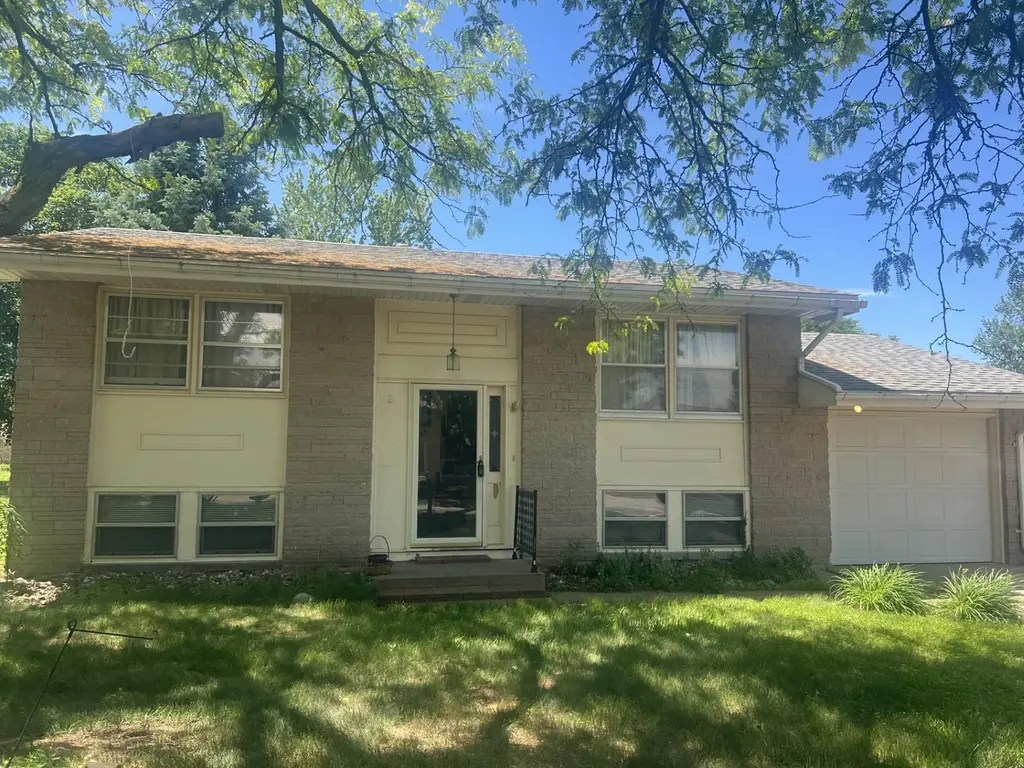
112 Linnwood Ln
Woodland Park, NE 68701
$199,000D-
2 bd · 2.0 ba ·
1,459 sqft ·
Built 1969
· SingleFamily
· Active
· 14 DOM
Cashflow @ list (25.0% down · 7.5%)
Estimated rent
$1,371/mo
Mortgage (P&I)
−$1,044
Tax + insurance
−$150
HOA
−$0
Vac / Maint / Mgmt
−$288
Net cashflow
$-111/mo
Annual
$-1,336/yr
Cap rate
5.62%
Cash-on-cash
-2.40%
DSCR
0.89
1% rule
0.69%
Cash to close
$55,720
Investor read
- This is a 2-bed/2.0-bath single-family listed at $199k.
- At list price, monthly cash flow is $-111 ($-1k/yr) — negative.
- To cash-flow at today's rent, offer at most $179k (9.9% below list).
- To meet the 1% rule (rent ≥ 1% of price), the offer needs to be $137k (31.1% below list).
- Only 14 days on market — expect competitive offers; lowballing is unlikely to land.
- Recommended offer: $137k (31.1% below list) — sets the bar for 1% rule.
- Local home prices are declining (-3.0%/yr); year-one equity from $1k of loan paydown is wiped out by about $6k of value loss. Plan a longer hold.
- Location reads 67/100 on livability (#293 in NE) — a middle-class / working-renter tenant base. Strengths: crime A+, cost of living A+, housing A+; Watch: employment D, health & safety D, amenities F.
- Norfolk Public Schools (town): math 44% / reading 46% proficiency, ranked #84 of 111 in NE (top 76%) — families likely to look elsewhere, expect single-tenant / working-renter base with shorter leases.
- Zoned schools: Woodland Park Elementary Sch (math 52% / reading 62%, grade C+, #136 of 502 statewide, top 31%, 208 students, 49% FRL); Norfolk Middle School (math 47% / reading 45%, grade D+, #60 of 128 statewide, top 48%, 600 students, 56% FRL); Norfolk Senior High School (math 44% / reading 38%, grade F, #180 of 261 statewide, top 69%, 1,346 students, 46% FRL).
- Market conditions: Rents rising (+3.3%/yr); 230 active listings in the ZIP; 8 units permitted in Stanton County in 2024 (0 in 5+ unit buildings).
- Stanton County population projected at -29% by 2050 — secular population decline; favor cash flow + early exit over multi-decade hold.
Questions for listing agent
- What do current leases actually rent for vs. the listed asking? Can we see a recent rent roll and the last 12 months of T-12 income?
- Built in 1969 — when were the roof, HVAC, electrical panel, plumbing, and water heater last replaced?
- Is there a deadline driving the sale (1031 exchange, divorce, estate, relocation)? That informs how much negotiation room exists.
- Schools are D-rated, which usually means shorter tenancies and higher turnover. Who's the typical renter profile here, and what's been the actual vacancy rate?
- The area grade is low — what's the realistic commute time and amenity access for the typical tenant pool here? Any planned neighborhood developments (good or bad) we should know about?
- What's the average days-on-market for RENTAL listings here right now (not sales)? A rising rental-DOM trend means longer vacancies and softer asking-rent achievability than the comps imply.
- What's the recent tenant-quality profile in this submarket — average credit score on applications, eviction rate, late-payment / NSF rate, and stable-employment percentage? A property-management company in the area should have these aggregated.
- How much new for-sale + rental construction is in the pipeline within 1–3 miles? Heavy new supply typically softens prices + rents 12–24 months out; constrained supply supports both.
CashFlowRE · CFR-X099WV6NVWC7C7
· Data 2 days ago
cashflowre.app · 2026-05-29