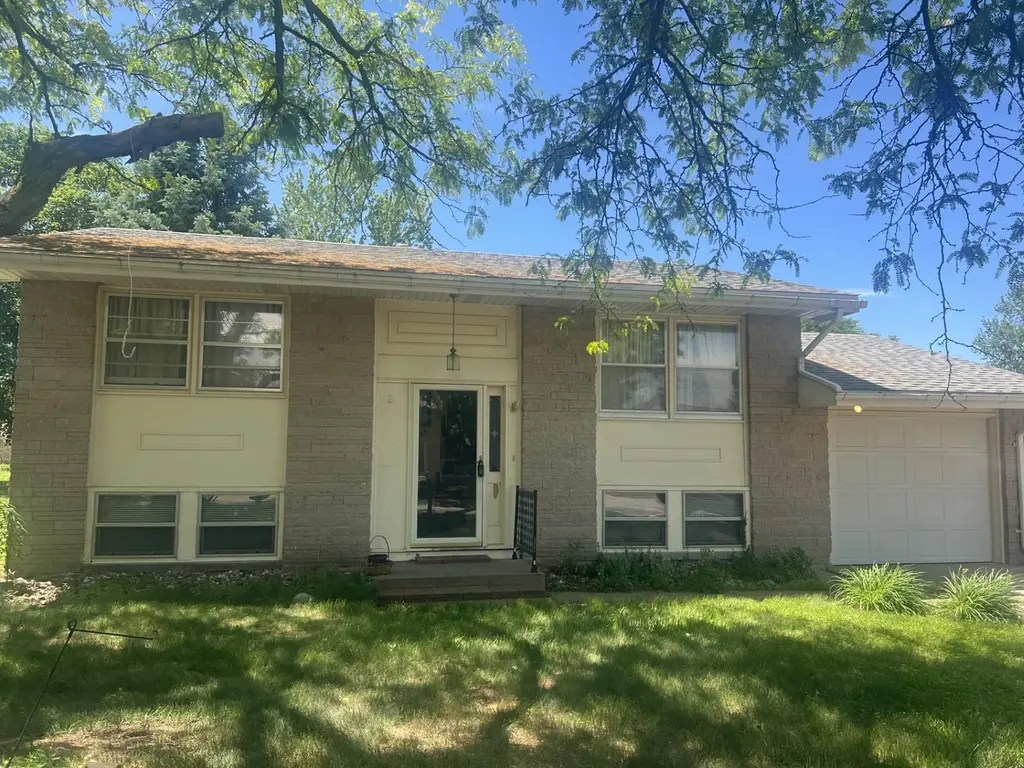
112 Linnwood Ln · Woodland Park, NE
Flood risk 1/10 · Minimal
- FEMA flood zone
- X (unshaded)
- Chance of flooding over 30 yrs
- 0.0%
- Est. flood insurance / yr
- $473 – $860
Fire risk 3/10 · Minor
- Est. fire insurance / yr
- $1,161 – $2,155
Heat risk 2/10 · Minimal
- Hot days now (above 101°F)
- 7 days/yr
- Hot days in 30 yrs
- 15 days/yr
Wind risk 2/10 · Minimal
- Chance of severe wind over 30 yrs
- —
Air-quality risk 2/10 · Minimal
- Unhealthy air days now
- 1 days/yr
- Unhealthy air days in 30 yrs
- 1 days/yr
Risk factors via First Street. Map © Google.
Why this score? — see what drove the D- grade
The composite is a weighted blend of 9 inputs, each scored 0–100. Each bar is that input's sub-score; the figure is the points it added to the 100-point composite (weight × sub-score).
- Cash flow +10.2/30.0
- ARV discount +10.2/15.0
- Schools +3.8/10.0
- Livability +3.4/5.0
- Rent growth +3.3/5.0
- DSCR +2.9/10.0
- Condition / age +2.5/5.0
- 1% rule +1.9/10.0
- Appreciation +0.0/10.0
$199,000
🖨 Deal sheet (PDF) 📄 Offer letter ✓ Due diligence
Listing remarks
Opportunity in Woodland Park - This solid home offers potential for the buyer willing to add their personal touches with some updates and improvements. This property could truly shine. Don't miss this affordable opportunity to make it your own!
Key facts
- 9,750 sq ft lot
- Garage
- Built 1969
Property features AI
Exterior
- Parking: Attached garage with garage door opener; 1 garage space
- Security: Smoke detector(s)
- Utilities: Cable available; Natural gas available
- Home design: Single-family residence; Residential property; Zoning: R-1
- Construction: Frame construction; Wood siding
- Exterior features: Deck; Patio; Composition roof
Interior
- Kitchen: Dishwasher; Electric range; Refrigerator; Electric water heater; Water softener
- Bedrooms: 2 main-level bedrooms
- Bathrooms: 1 main-level bathroom
- Heating & cooling: Forced air heating; Window unit cooling
- Interior features: Eat-in kitchen; Window coverings; Full basement
- Laundry & utility: Washer; Dryer; Laundry in basement
Neighborhood map
What this means for you Summary
Snapshot
- This is a 2-bed/2.0-bath single-family listed at $199k.
Deal economics
- At list price, monthly cash flow is $-111 ($-1k/yr) — negative.
- To cash-flow at today's rent, offer at most $179k (9.9% below list).
- To meet the 1% rule (rent ≥ 1% of price), the offer needs to be $137k (31.1% below list).
- Recommended offer: $137k (31.1% below list) — sets the bar for 1% rule.
Location & tenants
- Location reads 67/100 on livability (#293 in NE) — a middle-class / working-renter tenant base. Strengths: crime A+, cost of living A+, housing A+; Watch: employment D, health & safety D, amenities F.
- Norfolk Public Schools (town): math 44% / reading 46% proficiency, ranked #84 of 111 in NE (top 76%) — families likely to look elsewhere, expect single-tenant / working-renter base with shorter leases.
- Zoned schools: Woodland Park Elementary Sch (math 52% / reading 62%, grade C+, #136 of 502 statewide, top 31%, 208 students, 49% FRL); Norfolk Middle School (math 47% / reading 45%, grade D+, #60 of 128 statewide, top 48%, 600 students, 56% FRL); Norfolk Senior High School (math 44% / reading 38%, grade F, #180 of 261 statewide, top 69%, 1,346 students, 46% FRL).
- Market conditions: Rents rising (+3.3%/yr); 230 active listings in the ZIP; 8 units permitted in Stanton County in 2024 (0 in 5+ unit buildings).
Forward outlook
- Local home prices are declining (-3.0%/yr); year-one equity from $1k of loan paydown is wiped out by about $6k of value loss. Plan a longer hold.
- Stanton County population projected at -29% by 2050 — secular population decline; favor cash flow + early exit over multi-decade hold.
Negotiation context
- Only 14 days on market — expect competitive offers; lowballing is unlikely to land.
Questions for the listing agent
- What do current leases actually rent for vs. the listed asking? Can we see a recent rent roll and the last 12 months of T-12 income?
- Built in 1969 — when were the roof, HVAC, electrical panel, plumbing, and water heater last replaced?
- Is there a deadline driving the sale (1031 exchange, divorce, estate, relocation)? That informs how much negotiation room exists.
- Schools are D-rated, which usually means shorter tenancies and higher turnover. Who's the typical renter profile here, and what's been the actual vacancy rate?
- The area grade is low — what's the realistic commute time and amenity access for the typical tenant pool here? Any planned neighborhood developments (good or bad) we should know about?
- What's the average days-on-market for RENTAL listings here right now (not sales)? A rising rental-DOM trend means longer vacancies and softer asking-rent achievability than the comps imply.
- What's the recent tenant-quality profile in this submarket — average credit score on applications, eviction rate, late-payment / NSF rate, and stable-employment percentage? A property-management company in the area should have these aggregated.
- How much new for-sale + rental construction is in the pipeline within 1–3 miles? Heavy new supply typically softens prices + rents 12–24 months out; constrained supply supports both.
Investment metrics
- 1% rule
- 0.69% ✗
- Cap rate
- 5.62%
- Cash-on-cash
- -2.40%
- DSCR
- 0.89
- GRM
- 12.1
CMA / ARV
- ARV (on-the-fly)
- $211,555
- Comps found
- 12
Show comp detail 12 sales within ~0.75 mi
| Address | Dist | Beds/Ba | Sqft | Sold | Price | $/sf | Match |
|---|---|---|---|---|---|---|---|
| 401 Broadmoor Dr | 0.11mi | 3/2.0 (+1) | 1,459 (0%) | 15mo | $190,000 | $130 | 78 |
| 606 Meadow Ln | 0.22mi | 2/2.0 | 1,450 (-1%) | 14mo | $210,000 | $145 | 78 |
| 1803 Eastwood St | 0.07mi | 3/2.0 (+1) | 1,458 (-0%) | 18mo | $200,000 | $137 | 76 |
| 2105 Eastwood St | 0.34mi | 3/2.0 (+1) | 1,498 (+3%) | 2mo | $225,000 | $150 | 73 |
| 807 Meadow Ln | 0.40mi | 3/2.0 (+1) | 1,464 (+0%) | 4mo | $260,000 | $178 | 73 |
| 105 Market Pl | 0.31mi | 2/2.0 | 1,388 (-5%) | 7mo | $205,000 | $148 | 72 |
| 301 Windsor Dr | 0.14mi | 3/2.0 (+1) | 1,412 (-3%) | 16mo | $205,000 | $145 | 69 |
| 206 Market Pl | 0.36mi | 3/2.0 (+1) | 1,468 (+1%) | 12mo | $181,000 | $123 | 67 |
| 309 Broadmoor Dr | 0.11mi | 3/2.0 (+1) | 1,536 (+5%) | 17mo | $202,500 | $132 | 67 |
| 413 Market Pl | 0.39mi | 3/2.0 (+1) | 1,458 (-0%) | 12mo | $216,000 | $148 | 66 |
| 300 Forest | 0.32mi | 3/2.0 (+1) | 1,409 (-3%) | 12mo | $255,000 | $181 | 65 |
| 407 Market Pl | 0.39mi | 3/2.0 (+1) | 1,560 (+7%) | 15mo | $183,250 | $117 | 53 |
Match score weights: distance 35% · size 25% · config 20% · recency 20%. Top-matched comps best support the ARV.
Projected returns pro-forma
-3.0% appreciation · 3.31% rent growth · sell at horizon
- IRR
- -20.0%
- Equity multiple
- 0.30×
- Total profit
- $-38,998
- Equity at exit
- $29,672
- IRR
- -12.6%
- Equity multiple
- 0.25×
- Total profit
- $-41,686
- Equity at exit
- $17,206
Cash invested: $55,720 (down + closing). Projections, not guarantees.
Landlord ↔ Tenant lean methodology
- Overall (STATE)
- 83 Strongly Landlord-Friendly
- State Nebraska
- 83 Strongly Landlord-Friendly · R+13
- County
- — inherits STATE
- City
- — inherits STATE
ZIP-level market 68701
- Rents YoY
- 3.3%
- Active inventory
- 230
- Price-to-rent
- 12.1×
Monthly cashflow live
- Estimated rent
- $1,371 medium interval (Pro) →
- Mortgage (P&I)
- −$1,044
- Tax from tax record
- −$68 /mo · $810/yr
- Insurance
- −$83
- HOA
- −$0
- Vacancy / Maint / Mgmt
- −$288
- Net cashflow
- $-111
Break-even live
Sensitivity live
| Price | -10% $1 | -5% $-55 | +0% $-111 | +5% $-168 | +10% $-224 |
|---|---|---|---|---|---|
| Rent | -10% $-220 | -5% $-165 | +0% $-111 | +5% $-57 | +10% $-3 |
| Rate | -1.0pp $-11 | -0.5pp $-61 | base $-111 | +0.5pp $-163 | +1.0pp $-215 |
UW: 25.0% down · 7.5% · 30yr · 1.5% tax · 5.0% vac · 8.0% maint · 8.0% mgmt
Financing live
Cash to close
- Down payment
- $49,750
- Closing costs
- $5,970
- Reserves months
- —
- Total cash needed
- —
Loan-product check · same deal, 3 products live
Conventional
25% down · 7.5% · 30yr
- Down + closing
- —
- Monthly P&I
- —
- Monthly cashflow
- —
- DSCR
- —
- Eligible?
- —
Personal DTI + credit; lowest rate.
DSCR
20% down · 8.5% · 30yr
- Down + closing
- —
- Monthly P&I
- —
- Monthly cashflow
- —
- DSCR
- —
- Eligible?
- —
No personal income docs; deal must DSCR.
Hard money
10% down · 12.0% · 12mo
- Down + closing
- —
- Monthly P&I
- —
- Monthly cashflow
- —
- DSCR
- —
- Eligible?
- —
Short-term bridge; refi at stabilization.
Listing history 11 events
-
2026-06-19days on market $199,000 Active 14 DOM
-
2026-06-18days on market $199,000 Active 13 DOM
-
2026-06-17days on market $199,000 Active 12 DOM
-
2026-06-16days on market $199,000 Active 11 DOM
-
2026-06-15days on market $199,000 Active 10 DOM
-
2026-06-14days on market $199,000 Active 8 DOM
-
2026-06-12days on market $199,000 Active 7 DOM
-
2026-06-09days on market $199,000 Active 4 DOM
-
2026-06-08days on market $199,000 Active 3 DOM
-
2026-06-07remarks 244-char remark
-
2026-06-07$199,000 Active 2 DOM
ⓘ Source: listings_history table (triggers on properties + properties_extension) + one-shot
backfill from property_details.listing_events for pre-trigger history.
Tax reassessment forecast NE · Resets to sale price
- Current annual tax
- $810 · $68/mo
- Projected year-2 tax
- $3,443 · $287/mo
- Expected delta
- +$2,632/yr (+$219/mo · 324.8%)
ⓘ Screening estimate from a state-policy table — verify with the county assessor before closing.
Climate risk First Street
- Flood 1/10 Low FEMA zone X (unshaded) · 0% chance over 30 yrs
- Wildfire 3/10 Moderate
- Heat 2/10 Low 7 d/yr ≥101°F today · 15 d/yr by 30 yrs out
- Wind 2/10 Low
- Air quality 2/10 Low 1 unhealthy d/yr today · 1 by 30 yrs out
Nearby sold comps map
Loading sold comps map…
Walkable amenities ~0.75 mi
Loading nearby amenities…
Taxation est. · year 1
- Rental income
- $16,446
- − Mortgage interest
- −$11,147
- − Property taxes
- −$810
- − Insurance
- −$995
- − Repairs & maintenance
- −$1,316
- − Management
- −$1,316
- − Depreciation
- −$5,789
- Taxable loss
- −$4,927
- Est. tax savings @ 24.0%
- +$1,182
- After-tax cash flow
- $-153/yr
For passive investors: Depreciation is non-cash, so a rental often shows a tax loss while cash-flowing — sheltering income. Rental losses are passive: they offset passive income freely, and up to $25,000/yr can offset ordinary (W-2) income if you actively participate and your MAGI is under $100k (phasing out to $0 by $150k); unused losses carry forward. On sale, claimed depreciation is recaptured at up to 25%, and gains may owe capital-gains tax (a 1031 exchange can defer both). Figures are a year-1 estimate at your 24.0% rate — not tax advice; consult a CPA.
Schools (NCES district)
- District
- Norfolk Public Schools
- NCES district ID
- 3174430
- Math proficiency
- 44% ▼ -7.00%
- Reading proficiency
- 46% ▼ -7.00%
- Median HH income
- $46,579
- Composite
- 38.31/100
- National rank
- #4227
- State rank
- #84 of 111 in NE
Livability — Woodland Park
- Score
- 67/100
- State rank
- #293
- US rank
- #10967
Category grades
Schools grade is shown separately in the Schools card above.
Census & demographics
- Census place
- Woodland Park, NE
- County
- Madison County · 31,417 people
- City population
- 31,417
- Metro
- Norfolk, NE
- Population (ZIP)
- 31,417
- Household income
- $62,633
- Rent vs Own
- Severe rent burden
- 861.0
Population outlook (Stanton County) Hauer SSP2
- Today (2025)
- 5,408 people
- By 2030
- 5,121 · -5.3%
- By 2040
- 4,491 · -17.0%
- By 2050
- 3,855 · -28.7%
- By 2075
- 2,552 · -52.8%
- By 2100
- 1,412 · -73.9%
Race, ethnicity, and origin ACS 2023
- Neighborhood character
- Predominantly White (80%)
- Race & ethnicity
- White 80% Hispanic / Latino 14% Two or more races 9% Native American 1% Black 1%
- Hispanic origin (detail)
- Mexican 11% Cuban 1%
- Common ancestry
- Portuguese 2% Romanian 1% Lithuanian 1%
- Foreign-born
- 6% · Canada
- Languages at home
- 90% English-only · Spanish 9%
Political lean MEDSL · Stanton
- 2024 margin
- Solid R (+66.7) · D 16.1% · R 82.8% · Other 1.2%
- 2008→2024 swing
- -21.9pp toward R · 2008: -44.8pp · 2024: -66.7pp
- All cycles
- 2024: R+66.7 2020: R+64.1 2016: R+63.9 2012: R+51.0 2008: R+44.8
Not yet ingested
- Civics
- —
Market trends
- HPI YoY
- ▼ -172.61%
- Current HPI
- 260.5574
- Rent YoY
- ▲ 3.31%
- Metro
- Norfolk, NE
- State GDP YoY
- ▲ 0.68%
- F500 in state
- 2
Industry mix (Fortune 500 HQ in NE)
| Industry | F500 HQs | Revenue |
|---|---|---|
| Conglomerate | 1 | $371B |
|
||
Price history
1 event — show timeline
- 2026-06-04 Listed $199,000 NNEMLS
Property tax history
+636.2%/yrLatest (2020): $810 · +636.2% YoY. Source: county tax records.
Cash-flow waterfall
monthlySold comps — $/sqft
last 12 mo · ≤1 miLoading sold comps…