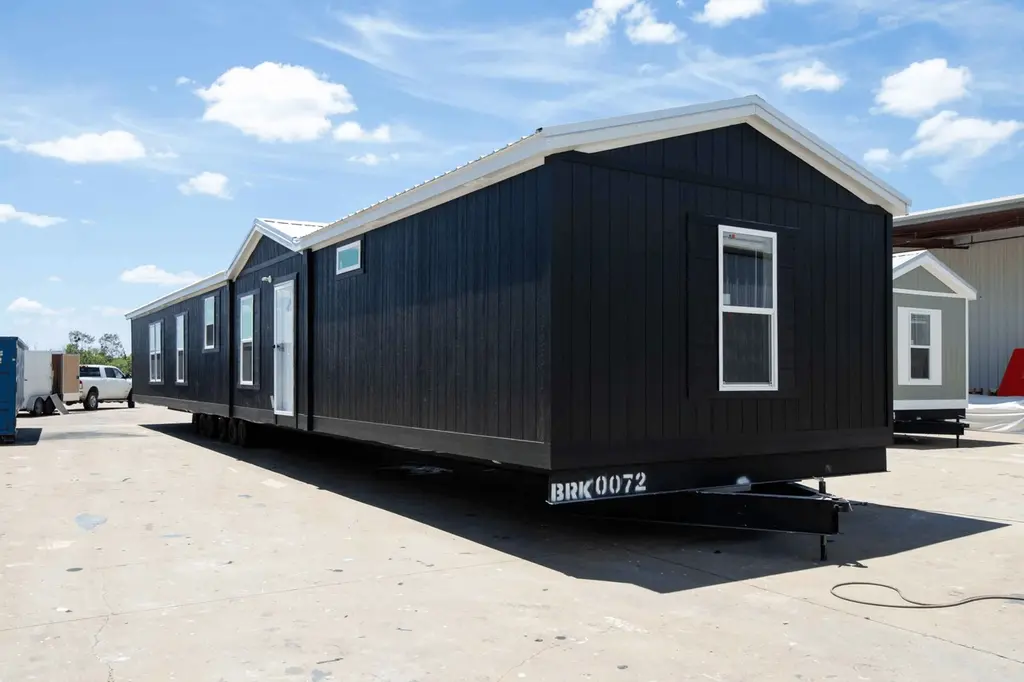
Marathon - Pearland Plan
Fort Worth, TX 76036
$98,995C-
3 bd · 2.0 ba ·
1,216 sqft ·
Built —
· Manufactured
· Active
· 211 DOM
Cashflow @ list (25.0% down · 7.5%)
Estimated rent
$2,088/mo
Mortgage (P&I)
−$519
Tax + insurance
−$165
HOA
−$905
Vac / Maint / Mgmt
−$438
Net cashflow
$60/mo
Annual
$720/yr
Cap rate
7.02%
Cash-on-cash
2.60%
DSCR
1.12
1% rule
2.11%
Cash to close
$27,719
Investor read
- This is a 3-bed/2.0-bath manufactured listed at $99k. Condition is rated good.
- At list price, monthly cash flow is $60 ($720/yr) — positive.
- The deal already cash-flows at list — no discount required.
- Meets the 1% rule at list price ($2k rent vs $99k).
- It's been on market 211 days — a 12% lower offer ($87k) is reasonable based on typical stale-listing flexibility.
- Recommended offer: $87k (12.0% below list) — sets the bar for market timing.
- Local home prices are declining (-3.0%/yr); year-one equity from $684 of loan paydown is wiped out by about $3k of value loss. Plan a longer hold.
- Location reads 80/100 on livability (#49 in TX, #1,954 nationally) — a professional / high-income tenant draw. Strengths: amenities A+, cost of living A+, housing A+; Watch: crime F.
- Crowley ISD (urban): math 23% / reading 32% proficiency, ranked #643 of 826 in TX (top 78%) — low school quality limits family demand, transient renter base, plan for 1-2y turnover.
- Zoned schools: Bess Race El (math 28% / reading 32%, grade F, #2,500 of 4,322 statewide, top 58%, 665 students, 77% FRL); H F Stevens Middle (math 16% / reading 26%, grade F, #1,387 of 1,662 statewide, top 85%, 747 students, 84% FRL); Crowley H S (math 23% / reading 36%, grade F, #1,112 of 1,632 statewide, top 70%, 2,351 students, 72% FRL) — zoned schools average 78% FRL vs 52% district-wide (26 pts higher); higher-poverty schools than district average — tighter screening recommended.
- Watch-outs: HOA is 43% of rent.
- Market conditions: Rents rising (+2.3%/yr); 1036 active listings in the ZIP; solid renter incomes; 18,938 units permitted in Tarrant County in 2024 (8,336 in 5+ unit buildings).
- Tarrant County population projected at +41% by 2050 — long-run rental-demand tailwind backs the buy-and-hold thesis.
- Cap rate 7.0% vs local median 3.9% in Fort Worth — top-decile yield for the area; either an underpriced asset or a hidden risk that comps aren't pricing in. Stress-test before assuming the spread holds.
Questions for listing agent
- It's been on market 211 days. Have you received any prior offers? Is the seller open to a 12% concession, seller financing, or rate buy-down credit?
- What does the HOA fee cover, when was the last increase, and are there any pending special assessments or reserve-fund shortfalls?
- Why hasn't it sold? Are there any deal-killer items the seller is aware of (foundation, flood, title, zoning, code violations)?
- Is there a deadline driving the sale (1031 exchange, divorce, estate, relocation)? That informs how much negotiation room exists.
- Schools are D-rated, which usually means shorter tenancies and higher turnover. Who's the typical renter profile here, and what's been the actual vacancy rate?
- Crime grade is F in this area — have there been break-ins, vandalism, or insurance claims at this property in the last 3 years? What carrier currently insures it and at what premium?
- What's the average days-on-market for RENTAL listings here right now (not sales)? A rising rental-DOM trend means longer vacancies and softer asking-rent achievability than the comps imply.
- What's the recent tenant-quality profile in this submarket — average credit score on applications, eviction rate, late-payment / NSF rate, and stable-employment percentage? A property-management company in the area should have these aggregated.
CashFlowRE · CFR-X0EHK4AX9GBMA4
· Data 1 week ago
cashflowre.app · 2026-05-29