 🏗️ New Construction
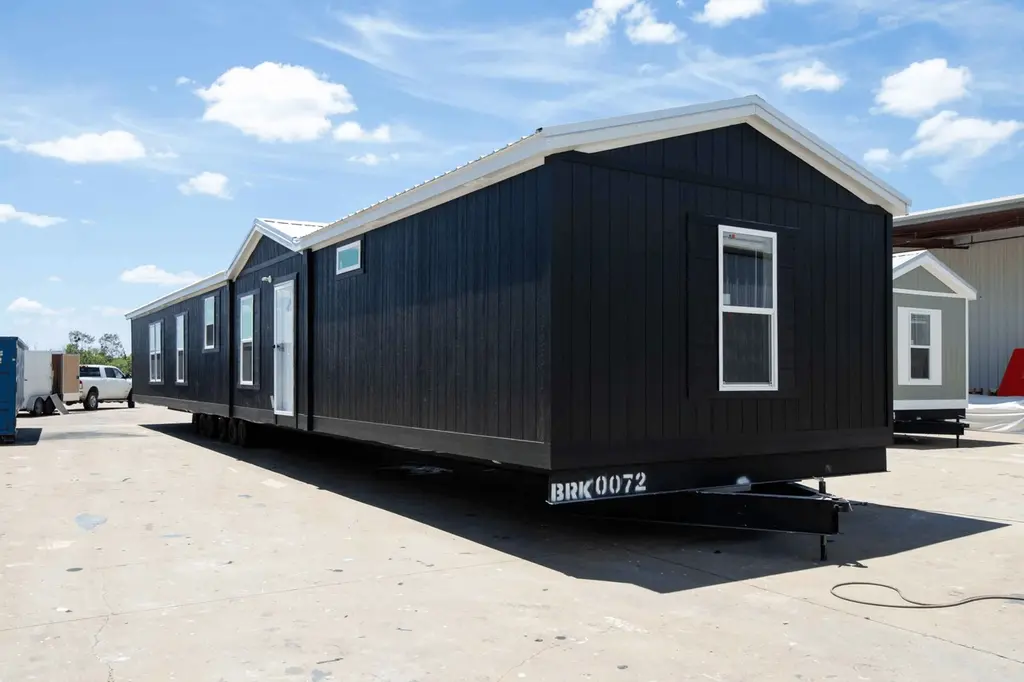
Marathon - Pearland Plan · Fort Worth, TX
Flood risk No data
- FEMA flood zone
- —
- Chance of flooding over 30 yrs
- —
- Est. flood insurance / yr
- —
Fire risk No data
- Est. fire insurance / yr
- —
Heat risk No data
- Hot days now (above threshold)
- —
- Hot days in 30 yrs
- —
Wind risk No data
- Chance of severe wind over 30 yrs
- —
Air-quality risk No data
- Unhealthy air days now
- —
- Unhealthy air days in 30 yrs
- —
Risk factors via First Street. Map © Google.
Why this score? — see what drove the C- grade
The composite is a weighted blend of 9 inputs, each scored 0–100. Each bar is that input's sub-score; the figure is the points it added to the 100-point composite (weight × sub-score).
- Cash flow +16.6/30.0
- 1% rule +10.0/10.0
- ARV discount +7.5/15.0
- DSCR +5.2/10.0
- Livability +4.0/5.0
- Condition / age +4.0/5.0
- Rent growth +3.1/5.0
- Schools +2.5/10.0
- Appreciation +0.0/10.0
$98,995
🖨 Deal sheet (PDF) 📄 Offer letter ✓ Due diligence
Listing remarks MLS
The Pearland by Marathon Homes makes everyday living easy with an open layout and plenty of space to spread out. You'll love the bright kitchen, roomy living area, and comfortable bedrooms that make this home feel welcoming from the start. Built with quality materials and thoughtful design, The Pearland is perfect for families looking for style, value, and comfort all in one.
Key facts
- Listed 210 days
Neighborhood map
What this means for you Summary
Snapshot
- This is a 3-bed/2.0-bath manufactured listed at $99k. Condition is rated good.
Deal economics
- At list price, monthly cash flow is $60 ($720/yr) — positive.
- The deal already cash-flows at list — no discount required.
- Meets the 1% rule at list price ($2k rent vs $99k).
- Recommended offer: $87k (12.0% below list) — sets the bar for market timing.
- Cap rate 7.0% vs local median 3.9% in Fort Worth — top-decile yield for the area; either an underpriced asset or a hidden risk that comps aren't pricing in. Stress-test before assuming the spread holds.
Location & tenants
- Location reads 80/100 on livability (#49 in TX, #1,954 nationally) — a professional / high-income tenant draw. Strengths: amenities A+, cost of living A+, housing A+; Watch: schools D+, crime F.
- Crowley ISD (urban): math 23% / reading 32% proficiency, ranked #643 of 826 in TX (top 78%) — low school quality limits family demand, transient renter base, plan for 1-2y turnover.
- Market conditions: Rents rising (+2.3%/yr); 1036 active listings in the ZIP; solid renter incomes; 18,938 units permitted in Tarrant County in 2024 (8,336 in 5+ unit buildings).
Forward outlook
- Local home prices are declining (-3.0%/yr); year-one equity from $684 of loan paydown is wiped out by about $3k of value loss. Plan a longer hold.
- Tarrant County population projected at +41% by 2050 — long-run rental-demand tailwind backs the buy-and-hold thesis.
Negotiation context
- It's been on market 211 days — a 12% lower offer ($87k) is reasonable based on typical stale-listing flexibility.
Risks & watch-outs
- Watch-outs: HOA is 43% of rent.
Questions for the listing agent
- It's been on market 211 days. Have you received any prior offers? Is the seller open to a 12% concession, seller financing, or rate buy-down credit?
- What does the HOA fee cover, when was the last increase, and are there any pending special assessments or reserve-fund shortfalls?
- Why hasn't it sold? Are there any deal-killer items the seller is aware of (foundation, flood, title, zoning, code violations)?
- Is there a deadline driving the sale (1031 exchange, divorce, estate, relocation)? That informs how much negotiation room exists.
- Schools are D-rated, which usually means shorter tenancies and higher turnover. Who's the typical renter profile here, and what's been the actual vacancy rate?
- Crime grade is F in this area — have there been break-ins, vandalism, or insurance claims at this property in the last 3 years? What carrier currently insures it and at what premium?
- What's the average days-on-market for RENTAL listings here right now (not sales)? A rising rental-DOM trend means longer vacancies and softer asking-rent achievability than the comps imply.
- What's the recent tenant-quality profile in this submarket — average credit score on applications, eviction rate, late-payment / NSF rate, and stable-employment percentage? A property-management company in the area should have these aggregated.
- How much new for-sale + rental construction is in the pipeline within 1–3 miles? Heavy new supply typically softens prices + rents 12–24 months out; constrained supply supports both.
Investment metrics
- 1% rule
- 2.11% ✓
- Cap rate
- 7.02%
- Cash-on-cash
- 2.60%
- DSCR
- 1.12
- GRM
- 4.0
CMA / ARV
No comps found within radius.
Projected returns pro-forma
-3.0% appreciation · 2.28% rent growth · sell at horizon
- IRR
- -13.3%
- Equity multiple
- 0.53×
- Total profit
- $-13,132
- Equity at exit
- $14,760
- IRR
- -6.0%
- Equity multiple
- 0.63×
- Total profit
- $-10,197
- Equity at exit
- $8,559
Cash invested: $27,719 (down + closing). Projections, not guarantees.
Landlord ↔ Tenant lean methodology
- Overall (STATE)
- 87 Strongly Landlord-Friendly
- State Texas
- 87 Strongly Landlord-Friendly · R+5
- County
- — inherits STATE
- City
- — inherits STATE
ZIP-level market 76036
- Home prices YoY
- -25.2%
- Rents YoY
- 2.3%
- Active inventory
- 1036
- Price-to-rent
- 4.0×
Monthly cashflow live
- Estimated rent
- $2,088 medium interval (Pro) →
- Mortgage (P&I)
- −$519
- Tax est. 1.5%
- −$124 /mo · $1,485/yr
- Insurance
- −$41
- HOA
- −$905
- Vacancy / Maint / Mgmt
- −$438
- Net cashflow
- $60
Break-even live
Sensitivity live
| Price | -10% $128 | -5% $94 | +0% $60 | +5% $26 | +10% $-8 |
|---|---|---|---|---|---|
| Rent | -10% $-105 | -5% $-22 | +0% $60 | +5% $142 | +10% $225 |
| Rate | -1.0pp $110 | -0.5pp $85 | base $60 | +0.5pp $34 | +1.0pp $8 |
UW: 25.0% down · 7.5% · 30yr · 1.5% tax · 5.0% vac · 8.0% maint · 8.0% mgmt
Financing live
Cash to close
- Down payment
- $24,749
- Closing costs
- $2,970
- Reserves months
- —
- Total cash needed
- —
Loan-product check · same deal, 3 products live
Conventional
25% down · 7.5% · 30yr
- Down + closing
- —
- Monthly P&I
- —
- Monthly cashflow
- —
- DSCR
- —
- Eligible?
- —
Personal DTI + credit; lowest rate.
DSCR
20% down · 8.5% · 30yr
- Down + closing
- —
- Monthly P&I
- —
- Monthly cashflow
- —
- DSCR
- —
- Eligible?
- —
No personal income docs; deal must DSCR.
Hard money
10% down · 12.0% · 12mo
- Down + closing
- —
- Monthly P&I
- —
- Monthly cashflow
- —
- DSCR
- —
- Eligible?
- —
Short-term bridge; refi at stabilization.
HOA detail
- Monthly dues
- $905 · $10,860/yr
Listing history 9 events
-
2026-06-09days on market $98,995 Active 211 DOM
-
2026-06-08days on market $98,995 Active 210 DOM
-
2026-06-07days on market $98,995 Active 209 DOM
-
2026-06-04days on market $98,995 Active 206 DOM
-
2026-06-03days on market $98,995 Active 205 DOM
-
2026-06-02days on market $98,995 Active 204 DOM
-
2026-06-01days on market $98,995 Active 203 DOM
-
2026-05-31days on market $98,995 Active 202 DOM
-
2025-11-10$98,995 Active 378-char remark
Show marketing remark (378 chars)
The Pearland by Marathon Homes makes everyday living easy with an open layout and plenty of space to spread out. You'll love the bright kitchen, roomy living area, and comfortable bedrooms that make this home feel welcoming from the start. Built with quality materials and thoughtful design, The Pearland is perfect for families looking for style, value, and comfort all in one.
ⓘ Source: listings_history table (triggers on properties + properties_extension) + one-shot
backfill from property_details.listing_events for pre-trigger history.
Nearby sold comps map
Loading sold comps map…
Walkable amenities ~0.75 mi
Loading nearby amenities…
Taxation est. · year 1
- Rental income
- $25,051
- − Mortgage interest
- −$5,545
- − Property taxes
- −$1,485
- − Insurance
- −$495
- − Repairs & maintenance
- −$2,004
- − Management
- −$2,004
- − HOA
- −$10,860
- − Depreciation
- −$2,880
- Taxable loss
- −$223
- Est. tax savings @ 24.0%
- +$53
- After-tax cash flow
- $774/yr
For passive investors: Depreciation is non-cash, so a rental often shows a tax loss while cash-flowing — sheltering income. Rental losses are passive: they offset passive income freely, and up to $25,000/yr can offset ordinary (W-2) income if you actively participate and your MAGI is under $100k (phasing out to $0 by $150k); unused losses carry forward. On sale, claimed depreciation is recaptured at up to 25%, and gains may owe capital-gains tax (a 1031 exchange can defer both). Figures are a year-1 estimate at your 24.0% rate — not tax advice; consult a CPA.
Condition & rehab AI · 12 photos
This manufactured home is in excellent condition with a modern kitchen, two bathrooms, and hardwood floors. It has a good exterior and no visible repairs needed. Potential value-adding updates include painting the exterior and landscaping the front yard.
Value-add opportunities
- Both Painting the exterior black — Enhances curb appeal and can increase both resale and rental value.
- Both Landscaping the front yard — Improves curb appeal and can increase both resale and rental value.
- Both Adding a front porch or entryway — Can increase both resale and rental value by enhancing curb appeal and providing a welcoming entrance.
Renovation cost estimate screening
Value-add ROI direction
- Both Painting the exterior black — Enhances curb appeal and can increase both resale and rental value. ↑
- Both Landscaping the front yard — Improves curb appeal and can increase both resale and rental value. ↑
- Both Adding a front porch or entryway — Can increase both resale and rental value by enhancing curb appeal and providing a welcoming entrance. ↑
ⓘ Cost ranges are severity-bucket heuristics (US national rule-of-thumb). Get contractor quotes + a written scope before underwriting a rehab budget.
Schools (NCES district)
- District
- Crowley ISD
- NCES district ID
- 4815910
- Math proficiency
- 23% ▼ -15.00%
- Reading proficiency
- 32% ▼ -6.00%
- Median HH income
- $59,810
- Composite
- 25.04/100
- National rank
- #7549
- State rank
- #643 of 826 in TX
Livability — Fort Worth
- Score
- 80/100
- State rank
- #49
- US rank
- #1954
Category grades
Schools grade is shown separately in the Schools card above.
Census & demographics
- County
- Tarrant County · 2,033,669 people
- City population
- 911,619
- Metro
- Dallas-Fort Worth-Arlington, TX
- Population (ZIP)
- 36,044
- Household income
- $97,973
- Rent vs Own
- Severe rent burden
- 584.0
Population outlook (Tarrant County) Hauer SSP2
- Today (2025)
- 2,380,417 people
- By 2030
- 2,578,900 · +8.3%
- By 2040
- 2,974,995 · +25.0%
- By 2050
- 3,350,489 · +40.8%
- By 2075
- 4,216,909 · +77.2%
- By 2100
- 4,741,527 · +99.2%
Race, ethnicity, and origin ACS 2023
- Neighborhood character
- Diverse neighborhood (Simpson 0.65)
- Race & ethnicity
- White 48% Hispanic / Latino 28% Black 20% Two or more races 14% Asian 2%
- Hispanic origin (detail)
- Mexican 23% Puerto Rican 2%
- Common ancestry
- Slovak 3% Italian 2% Serbian 1%
- Foreign-born
- 8% · Canada, Vietnam
- Languages at home
- 79% English-only · Spanish 18% Other Indo-European 1% Vietnamese 1%
Political lean MEDSL · Tarrant
- 2024 margin
- Lean R (+5.1) · D 46.7% · R 51.9% · Other 1.4%
- 2008→2024 swing
- +6.6pp toward D · 2008: -11.7pp · 2024: -5.1pp
- All cycles
- 2024: R+5.1 2020: D+0.2 2016: R+8.7 2012: R+15.7 2008: R+11.7
Not yet ingested
- Civics
- —
Market trends
- HPI YoY
- ▼ -80.45%
- Current HPI
- 238.6365
- Rent YoY
- ▲ 2.28%
- Metro
- Dallas-Fort Worth-Arlington, TX
- State GDP YoY
- ▲ 3.95%
- F500 in state
- 110
Industry mix (Fortune 500 HQ in TX)
| Industry | F500 HQs | Revenue |
|---|---|---|
| Energy | 16 | $1,198B |
|
||
| Technology | 5 | $198B |
|
||
| Engineering / Construction | 4 | $72B |
|
||
| Energy Services | 3 | $60B |
|
||
| Utilities | 3 | $41B |
|
||
| Healthcare | 2 | $330B |
|
||
Price history
1 event — show timeline
- 2025-11-10 Listed $98,995 Zillow
Cash-flow waterfall
monthlySold comps — $/sqft
last 12 mo · ≤1 miLoading sold comps…