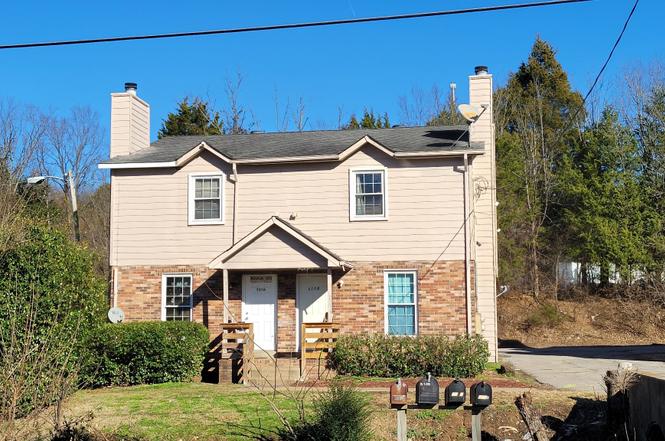
5104 Linbar Dr
Nashville-Davidson metropolitan government (balance), TN 37211
$515,000D+
8 bd · 4.0 ba ·
2,244 sqft ·
Built 1983
· MultiFamily
· Pending
· 318 DOM
Cashflow @ list (25.0% down · 7.5%)
Estimated rent
$5,018/mo
Mortgage (P&I)
−$2,701
Tax + insurance
−$608
HOA
−$0
Vac / Maint / Mgmt
−$1,054
Net cashflow
$656/mo
Annual
$7,870/yr
Cap rate
7.82%
Cash-on-cash
5.46%
DSCR
1.24
1% rule
0.97%
Cash to close
$144,200
Investor read
- This is a 4 × 1-bed/1.0-bath units multifamily listed at $515k.
- At list price, monthly cash flow is $656 ($8k/yr) — positive. Per door: $164/mo.
- The deal already cash-flows at list — no discount required.
- To meet the 1% rule (rent ≥ 1% of price), the offer needs to be $502k (2.6% below list).
- It's been on market 318 days — a 12% lower offer ($453k) is reasonable based on typical stale-listing flexibility.
- Recommended offer: $453k (12.0% below list) — sets the bar for market timing.
- Local home prices are declining (-3.0%/yr); year-one equity from $4k of loan paydown is wiped out by about $15k of value loss. Plan a longer hold.
- Location reads: area grade D — affects rentability + tenant quality, not the cash-flow math above.
- Davidson County (urban): math 12% / reading 19% proficiency, ranked #126 of 139 in TN (top 91%) — low school quality limits family demand, transient renter base, plan for 1-2y turnover; 66% free/reduced lunch — lower-income household profile, screen leases tightly.
- Zoned schools: Haywood Elementary (math 2% / reading 12%, grade F, #863 of 952 statewide, top 92%, 575 students, 0% FRL); John Overton High (math 0% / reading 22%, grade F, #267 of 332 statewide, top 80%, 2,016 students, 0% FRL) — zoned schools average 0% FRL vs 66% district-wide (66 pts lower); this property's tenant base skews higher-income than the district average.
- Market conditions: Rents soft (-0.2%/yr); 454 active listings in the ZIP; 6,873 units permitted in Davidson County in 2024 (4,138 in 5+ unit buildings).
- Davidson County population projected at +42% by 2050 — long-run rental-demand tailwind backs the buy-and-hold thesis.
- 6 sale attempts since 12y ago; this cycle's ask has dropped $30k (5%) from the opening price — seller is motivated, your offer sets the floor, not the list.
- Cap rate 7.8% vs local median 2.9% in Nashville-Davidson metropolitan government (balance) — top-decile yield for the area; either an underpriced asset or a hidden risk that comps aren't pricing in. Stress-test before assuming the spread holds.
- At $5,018/mo this rent would consume 84% of the median local household income ($71k/yr) (locally 4645% of renters already pay >50% of income on rent) — very limited rent-growth headroom before tenants either downsize or default.
Questions for listing agent
- It's been on market 318 days. Have you received any prior offers? Is the seller open to a 12% concession, seller financing, or rate buy-down credit?
- Can we see the unit-by-unit rent roll, current vacancy, and any below-market leases? What's the average tenancy length?
- What capital expenditures (roof, boiler, parking lot, exteriors) have been made in the last 5 years, and what's planned in the next 2?
- Why hasn't it sold? Are there any deal-killer items the seller is aware of (foundation, flood, title, zoning, code violations)?
- Is there a deadline driving the sale (1031 exchange, divorce, estate, relocation)? That informs how much negotiation room exists.
- The area grade is low — what's the realistic commute time and amenity access for the typical tenant pool here? Any planned neighborhood developments (good or bad) we should know about?
- What's the average days-on-market for RENTAL listings here right now (not sales)? A rising rental-DOM trend means longer vacancies and softer asking-rent achievability than the comps imply.
- What's the recent tenant-quality profile in this submarket — average credit score on applications, eviction rate, late-payment / NSF rate, and stable-employment percentage? A property-management company in the area should have these aggregated.
CashFlowRE · CFR-X223V188PJG245
· Data 1 week ago
cashflowre.app · 2026-05-29