 Fourplex
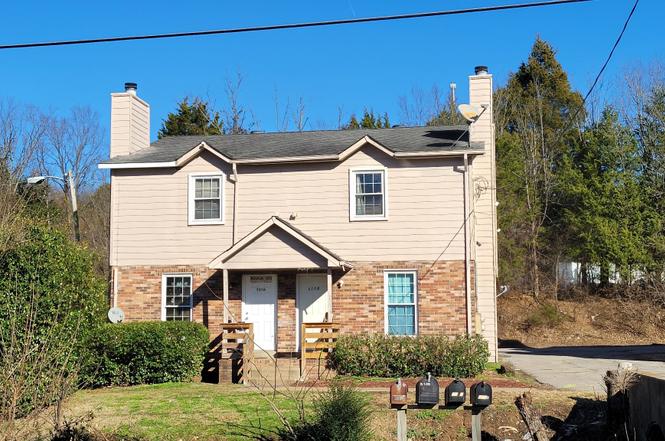
5104 Linbar Dr · Nashville-Davidson metropolitan government (balance), TN
Flood risk No data
- FEMA flood zone
- —
- Chance of flooding over 30 yrs
- —
- Est. flood insurance / yr
- —
Fire risk No data
- Est. fire insurance / yr
- —
Heat risk No data
- Hot days now (above threshold)
- —
- Hot days in 30 yrs
- —
Wind risk No data
- Chance of severe wind over 30 yrs
- —
Air-quality risk No data
- Unhealthy air days now
- —
- Unhealthy air days in 30 yrs
- —
Risk factors via First Street. Map © Google.
Why this score? — see what drove the D+ grade
The composite is a weighted blend of 9 inputs, each scored 0–100. Each bar is that input's sub-score; the figure is the points it added to the 100-point composite (weight × sub-score).
- Cash flow +20.3/30.0
- ARV discount +7.5/15.0
- DSCR +6.4/10.0
- 1% rule +4.7/10.0
- Rent growth +2.5/5.0
- Livability +2.5/5.0
- Condition / age +2.5/5.0
- Schools +1.4/10.0
- Appreciation +0.0/10.0
$515,000
🖨 Deal sheet (PDF) 📄 Offer letter ✓ Due diligence
Multi-family units
County records classify this as Multi-Family (2-4 Unit). Listing-text estimate: 4 units. confirmed
Listing remarks MLS
Don't miss out on this awesome Investment property! Four units (5104-5110) with great cash flow. 100% occupancy rate in last year. **Similar quadplex 5120 Linbar also on market 'for sale'** Seller has done many improvements, hardwood floors in some units - cement siding - concrete drive - all appliances convey with property. Location! Location! Close proximity to I24, Harding Pl, Haywood Ln.
Key facts
- 7,998 sq ft lot
- Built 1983
- Listed 318 days
Property features AI
Finance
- Other: Zoning: OR20
- Financial info: Gross income reported at $50,700; Net operating income reported at $43,479; Tenants pay electricity, trash collection, and water; Owner pays: none listed
- HOA & community: No HOA information provided
Exterior
- Parking: No covered spaces; No designated parking total provided
- Security: No security features provided
- Utilities: Public water; Public sewer; Water service available
- Home design: Quadruplex (residential income property); Attached property; Two levels
- Construction: Fiber cement and brick exterior construction; Existing structure (year built not specified)
- Exterior features: Lot dimensions approximately 62 x 129
Interior
- Kitchen: No kitchen appliance details provided
- Bedrooms: Four 1-bedroom units (total of 4 units)
- Flooring: Wood flooring; Tile flooring; Vinyl flooring
- Bathrooms: Each unit has 1 bathroom
- Heating & cooling: Wall furnace heating; Wall/window air conditioning units
- Interior features: Wood, tile, and vinyl flooring
- Laundry & utility: No laundry or utility room details provided
Neighborhood map
What this means for you Summary
Snapshot
- This is a 4 × 1-bed/1.0-bath units multifamily listed at $515k.
Deal economics
- At list price, monthly cash flow is $656 ($8k/yr) — positive. Per door: $164/mo.
- The deal already cash-flows at list — no discount required.
- To meet the 1% rule (rent ≥ 1% of price), the offer needs to be $502k (2.6% below list).
- Recommended offer: $453k (12.0% below list) — sets the bar for market timing.
- Cap rate 7.8% vs local median 2.9% in Nashville-Davidson metropolitan government (balance) — top-decile yield for the area; either an underpriced asset or a hidden risk that comps aren't pricing in. Stress-test before assuming the spread holds.
Location & tenants
- Location reads: area grade D — affects rentability + tenant quality, not the cash-flow math above.
- Davidson County (urban): math 12% / reading 19% proficiency, ranked #126 of 139 in TN (top 91%) — low school quality limits family demand, transient renter base, plan for 1-2y turnover; 66% free/reduced lunch — lower-income household profile, screen leases tightly.
- Zoned schools: Haywood Elementary (math 2% / reading 12%, grade F, #863 of 952 statewide, top 92%, 575 students, 0% FRL); John Overton High (math 0% / reading 22%, grade F, #267 of 332 statewide, top 80%, 2,016 students, 0% FRL) — zoned schools average 0% FRL vs 66% district-wide (66 pts lower); this property's tenant base skews higher-income than the district average.
- Market conditions: Rents soft (-0.2%/yr); 454 active listings in the ZIP; 6,873 units permitted in Davidson County in 2024 (4,138 in 5+ unit buildings).
- At $5,018/mo this rent would consume 84% of the median local household income ($71k/yr) (locally 4645% of renters already pay >50% of income on rent) — very limited rent-growth headroom before tenants either downsize or default.
Forward outlook
- Local home prices are declining (-3.0%/yr); year-one equity from $4k of loan paydown is wiped out by about $15k of value loss. Plan a longer hold.
- Davidson County population projected at +42% by 2050 — long-run rental-demand tailwind backs the buy-and-hold thesis.
Negotiation context
- It's been on market 318 days — a 12% lower offer ($453k) is reasonable based on typical stale-listing flexibility.
- 6 sale attempts since 12y ago; this cycle's ask has dropped $30k (5%) from the opening price — seller is motivated, your offer sets the floor, not the list.
Questions for the listing agent
- It's been on market 318 days. Have you received any prior offers? Is the seller open to a 12% concession, seller financing, or rate buy-down credit?
- Can we see the unit-by-unit rent roll, current vacancy, and any below-market leases? What's the average tenancy length?
- What capital expenditures (roof, boiler, parking lot, exteriors) have been made in the last 5 years, and what's planned in the next 2?
- Why hasn't it sold? Are there any deal-killer items the seller is aware of (foundation, flood, title, zoning, code violations)?
- Is there a deadline driving the sale (1031 exchange, divorce, estate, relocation)? That informs how much negotiation room exists.
- The area grade is low — what's the realistic commute time and amenity access for the typical tenant pool here? Any planned neighborhood developments (good or bad) we should know about?
- What's the average days-on-market for RENTAL listings here right now (not sales)? A rising rental-DOM trend means longer vacancies and softer asking-rent achievability than the comps imply.
- What's the recent tenant-quality profile in this submarket — average credit score on applications, eviction rate, late-payment / NSF rate, and stable-employment percentage? A property-management company in the area should have these aggregated.
- How much new apartment / multifamily construction is in the pipeline within 1–3 miles? Heavy new supply (>2% of stock underway) typically softens rents 12–24 months out; light construction supports rent growth.
Investment metrics
- 1% rule
- 0.97% ✗
- Cap rate
- 7.82%
- Cash-on-cash
- 5.46%
- DSCR
- 1.24
- GRM
- 8.6
CMA / ARV
No comps found within radius.
Projected returns pro-forma
-3.0% appreciation · 0.0% rent growth · sell at horizon
- IRR
- -11.1%
- Equity multiple
- 0.61×
- Total profit
- $-56,468
- Equity at exit
- $76,788
- IRR
- -6.5%
- Equity multiple
- 0.64×
- Total profit
- $-52,538
- Equity at exit
- $44,528
Cash invested: $144,200 (down + closing). Projections, not guarantees.
Landlord ↔ Tenant lean methodology
- Overall (STATE)
- 87 Strongly Landlord-Friendly
- State Tennessee
- 87 Strongly Landlord-Friendly · R+13
- County
- — inherits STATE
- City
- — inherits STATE
ZIP-level market 37211
- Rents YoY
- -0.2%
- Active inventory
- 454
- Price-to-rent
- 34.2×
Monthly cashflow live
- Estimated rent
- $5,018 high interval (Pro) →
- Mortgage (P&I)
- −$2,701
- Tax from tax record
- −$393 /mo · $4,717/yr
- Insurance
- −$215
- HOA
- −$0
- Vacancy / Maint / Mgmt
- −$1,054
- Net cashflow
- $656
Break-even live
Sensitivity live
| Price | -10% $947 | -5% $802 | +0% $656 | +5% $510 | +10% $364 |
|---|---|---|---|---|---|
| Rent | -10% $259 | -5% $458 | +0% $656 | +5% $854 | +10% $1,052 |
| Rate | -1.0pp $915 | -0.5pp $787 | base $656 | +0.5pp $522 | +1.0pp $387 |
4-unit breakdown (identical units grouped — click to expand)
| Units | Beds | Baths | Est. rent |
|---|---|---|---|
| 4× units | 1 | 1 | $5,020 |
| #1 | 1 | 1 | $1,255 |
| #2 | 1 | 1 | $1,255 |
| #3 | 1 | 1 | $1,255 |
| #4 | 1 | 1 | $1,255 |
| Total (4 units) | $5,018 | ||
UW: 25.0% down · 7.5% · 30yr · 1.5% tax · 5.0% vac · 8.0% maint · 8.0% mgmt
Financing live
Cash to close
- Down payment
- $128,750
- Closing costs
- $15,450
- Reserves months
- —
- Total cash needed
- —
Loan-product check · same deal, 3 products live
Conventional
25% down · 7.5% · 30yr
- Down + closing
- —
- Monthly P&I
- —
- Monthly cashflow
- —
- DSCR
- —
- Eligible?
- —
Personal DTI + credit; lowest rate.
DSCR
20% down · 8.5% · 30yr
- Down + closing
- —
- Monthly P&I
- —
- Monthly cashflow
- —
- DSCR
- —
- Eligible?
- —
No personal income docs; deal must DSCR.
Hard money
10% down · 12.0% · 12mo
- Down + closing
- —
- Monthly P&I
- —
- Monthly cashflow
- —
- DSCR
- —
- Eligible?
- —
Short-term bridge; refi at stabilization.
Listing history 30 events
-
2026-06-13statusdays on market $515,000 Pending 318 DOM
-
2026-06-09days on market $515,000 Active 317 DOM
-
2026-06-08days on market $515,000 Active 316 DOM
-
2026-06-07days on market $515,000 Active 315 DOM
-
2026-06-05days on market $515,000 Active 312 DOM
-
2026-06-03days on market $515,000 Active 311 DOM
-
2026-06-02days on market $515,000 Active 310 DOM
-
2026-06-01days on market $515,000 Active 309 DOM
-
2026-05-31days on market $515,000 Active 308 DOM
-
2026-04-02status Active
-
2026-04-02historical
-
2026-01-15status Active
-
2026-01-01historical
-
2025-11-18price $515,000
-
2025-07-14$544,900 Active
-
2025-07-11historical $544,900
-
2022-03-31soldstatus $477,000
-
2022-03-14soldstatus $477,000 Closed 395-char remark
Show marketing remark (395 chars)
Don't miss out on this awesome Investment property! Four units (5104-5110) with great cash flow. 100% occupancy rate in last year. **Similar quadplex 5120 Linbar also on market 'for sale'** Seller has done many improvements, hardwood floors in some units - cement siding - concrete drive - all appliances convey with property. Location! Location! Close proximity to I24, Harding Pl, Haywood Ln.
-
2022-02-28status Pending 395-char remark
Show marketing remark (395 chars)
Don't miss out on this awesome Investment property! Four units (5104-5110) with great cash flow. 100% occupancy rate in last year. **Similar quadplex 5120 Linbar also on market 'for sale'** Seller has done many improvements, hardwood floors in some units - cement siding - concrete drive - all appliances convey with property. Location! Location! Close proximity to I24, Harding Pl, Haywood Ln.
-
2022-02-04historical Active Under Contract 395-char remark
Show marketing remark (395 chars)
Don't miss out on this awesome Investment property! Four units (5104-5110) with great cash flow. 100% occupancy rate in last year. **Similar quadplex 5120 Linbar also on market 'for sale'** Seller has done many improvements, hardwood floors in some units - cement siding - concrete drive - all appliances convey with property. Location! Location! Close proximity to I24, Harding Pl, Haywood Ln.
-
2022-01-28$487,500 Active 395-char remark
Show marketing remark (395 chars)
Don't miss out on this awesome Investment property! Four units (5104-5110) with great cash flow. 100% occupancy rate in last year. **Similar quadplex 5120 Linbar also on market 'for sale'** Seller has done many improvements, hardwood floors in some units - cement siding - concrete drive - all appliances convey with property. Location! Location! Close proximity to I24, Harding Pl, Haywood Ln.
-
2021-05-13historical
-
2021-02-15$549,000 Active
-
2020-09-17soldstatus $350,000
-
2014-03-10soldstatus $117,000
-
2014-03-10soldstatus $117,000 Closed
-
2014-02-10historical
-
2014-01-31$122,500
-
2007-07-16soldstatus $185,000
-
2002-07-02soldstatus $125,000
ⓘ Source: listings_history table (triggers on properties + properties_extension) + one-shot
backfill from property_details.listing_events for pre-trigger history.
Tax reassessment forecast TN · Resets to sale price
- Current annual tax
- $4,717 · $393/mo
- Projected year-2 tax
- $4,717 · $393/mo
- Expected delta
- $0/yr ($0/mo · 0.0%)
ⓘ Screening estimate from a state-policy table — verify with the county assessor before closing.
Nearby sold comps map
Loading sold comps map…
Walkable amenities ~0.75 mi
Loading nearby amenities…
Taxation est. · year 1
- Rental income
- $60,216
- − Mortgage interest
- −$28,848
- − Property taxes
- −$4,717
- − Insurance
- −$2,575
- − Repairs & maintenance
- −$4,817
- − Management
- −$4,817
- − Depreciation
- −$14,982
- Taxable loss
- −$541
- Est. tax savings @ 24.0%
- +$130
- After-tax cash flow
- $7,999/yr
For passive investors: Depreciation is non-cash, so a rental often shows a tax loss while cash-flowing — sheltering income. Rental losses are passive: they offset passive income freely, and up to $25,000/yr can offset ordinary (W-2) income if you actively participate and your MAGI is under $100k (phasing out to $0 by $150k); unused losses carry forward. On sale, claimed depreciation is recaptured at up to 25%, and gains may owe capital-gains tax (a 1031 exchange can defer both). Figures are a year-1 estimate at your 24.0% rate — not tax advice; consult a CPA.
Schools (NCES district)
- District
- Davidson County
- NCES district ID
- 4703180
- Math proficiency
- 12% ▼ -17.00%
- Reading proficiency
- 19% ▼ -7.00%
- Median HH income
- $48,667
- Composite
- 14.03/100
- National rank
- #9472
- State rank
- #126 of 139 in TN
Livability — Nashville-Davidson metropolitan government (balance)
No livability data for this city. (Only ~50 U.S. cities are tracked.)
Census & demographics
- Census place
- Nashville-Davidson metropolitan government (balance), TN
- County
- Davidson County · 680,067 people
- City population
- 677,595
- Metro
- Nashville-Davidson--Murfreesboro--Franklin, TN
- Population (ZIP)
- 76,573
- Household income
- $71,399
- Rent vs Own
- Severe rent burden
- 4645.0
Population outlook (Davidson County) Hauer SSP2
- Today (2025)
- 808,568 people
- By 2030
- 874,489 · +8.2%
- By 2040
- 1,009,046 · +24.8%
- By 2050
- 1,147,294 · +41.9%
- By 2075
- 1,475,439 · +82.5%
- By 2100
- 1,714,101 · +112.0%
Race, ethnicity, and origin ACS 2023
- Neighborhood character
- Diverse neighborhood (Simpson 0.66)
- Race & ethnicity
- White 50% Hispanic / Latino 26% Black 15% Two or more races 13% Asian 5%
- Hispanic origin (detail)
- Mexican 14%
- Common ancestry
- Arab 1% Serbian 1% Romanian 1%
- Foreign-born
- 26% · Canada, Vietnam, South Korea
- Languages at home
- 65% English-only · Spanish 21% Other Indo-European 4% Arabic 3%
Political lean MEDSL · Davidson
- 2024 margin
- Strong D (+27.4) · D 62.7% · R 35.3% · Other 2.0%
- 2008→2024 swing
- +6.5pp toward D · 2008: 21.0pp · 2024: 27.4pp
- All cycles
- 2024: D+27.4 2020: D+32.1 2016: D+26.0 2012: D+18.7 2008: D+21.0
Not yet ingested
- Civics
- —
Market trends
- HPI YoY
- ▼ -278.35%
- Current HPI
- 312.7189
- Rent YoY
- ▼ -0.19%
- Metro
- Nashville-Davidson--Murfreesboro--Franklin, TN
- State GDP YoY
- ▲ 2.78%
- F500 in state
- 22
Industry mix (Fortune 500 HQ in TN)
| Industry | F500 HQs | Revenue |
|---|---|---|
| Healthcare | 3 | $91B |
|
||
| Retail | 3 | $72B |
|
||
| Transportation / Logistics | 1 | $88B |
|
||
| Paper / Packaging | 1 | $19B |
|
||
| Insurance | 1 | $13B |
|
||
| Energy | 1 | $12B |
|
||
Price history
+312.0% since first listed21 events — show timeline
- 2026-04-02 Relisted — REALTRACS as Distributed by MLS Grid
- 2026-04-02 Listing Removed — REALTRACS as Distributed by MLS Grid
- 2026-01-15 Relisted — REALTRACS as Distributed by MLS Grid
- 2026-01-01 Listing Removed — REALTRACS as Distributed by MLS Grid
- 2025-11-18 Price Changed $515,000 REALTRACS as Distributed by MLS Grid
- 2025-07-14 Listed $544,900 REALTRACS as Distributed by MLS Grid
- 2025-07-11 Coming Soon $544,900 REALTRACS as Distributed by MLS Grid
- 2022-03-31 Sold (Public Records) $477,000 Public Records
- 2022-03-14 Sold (MLS) $477,000 REALTRACS as Distributed by MLS Grid
- 2022-02-28 Pending — REALTRACS as Distributed by MLS Grid
- 2022-02-04 Contingent — REALTRACS as Distributed by MLS Grid
- 2022-01-28 Listed $487,500 REALTRACS as Distributed by MLS Grid
- 2021-05-13 Listing Removed — REALTRACS as Distributed by MLS Grid
- 2021-02-15 Listed $549,000 REALTRACS as Distributed by MLS Grid
- 2020-09-17 Sold (Public Records) $350,000 Public Records
- 2014-03-10 Sold (MLS) $117,000 REALTRACS as Distributed by MLS Grid
- 2014-03-10 Sold (MLS) $117,000 REALTRACS as Distributed by MLS Grid
- 2014-02-10 Listing Removed — REALTRACS as Distributed by MLS Grid
- 2014-01-31 Listed $122,500 REALTRACS as Distributed by MLS Grid
- 2007-07-16 Sold (Public Records) $185,000 Public Records
- 2002-07-02 Sold (Public Records) $125,000 Public Records
Property tax history
+6.0%/yrLatest (2025): $4,717 · +4.8% YoY. Source: county tax records.
Cash-flow waterfall
monthlySold comps — $/sqft
last 12 mo · ≤1 miLoading sold comps…