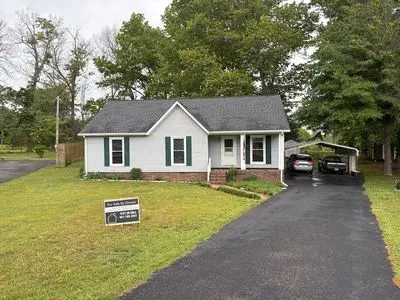
2857 Oak Park Dr
Cookeville, TN 38506
$278,000D
3 bd · 2.0 ba ·
1,484 sqft ·
Built 2009
· SingleFamily
· Active
· 40 DOM
Cashflow @ list (25.0% down · 7.5%)
Estimated rent
$2,052/mo
Mortgage (P&I)
−$1,458
Tax + insurance
−$201
HOA
−$0
Vac / Maint / Mgmt
−$431
Net cashflow
$-38/mo
Annual
$-452/yr
Cap rate
6.13%
Cash-on-cash
-0.58%
DSCR
0.97
1% rule
0.74%
Cash to close
$77,840
Investor read
- This is a 3-bed/2.0-bath single-family listed at $278k.
- At list price, monthly cash flow is $-38 ($-452/yr) — negative.
- To cash-flow at today's rent, offer at most $271k (2.4% below list).
- To meet the 1% rule (rent ≥ 1% of price), the offer needs to be $205k (26.2% below list).
- It's been on market 40 days — a 3% lower offer ($270k) is reasonable based on typical stale-listing flexibility.
- Recommended offer: $205k (26.2% below list) — sets the bar for 1% rule.
- Local home prices are declining (-3.0%/yr); year-one equity from $2k of loan paydown is wiped out by about $8k of value loss. Plan a longer hold.
- Location reads 76/100 on livability (#11 in TN, #3,551 nationally) — a middle-class / working-renter tenant base. Strengths: amenities A+, cost of living A+, health & safety A+; Watch: schools D-, commute F, employment F.
- Putnam County (town): math 32% / reading 31% proficiency, ranked #49 of 139 in TN (top 35%) — families likely to look elsewhere, expect single-tenant / working-renter base with shorter leases.
- Market conditions: 332 active listings in the ZIP; 4 comparable units currently listed for rent nearby; rentals lingering (median 45d on market — plan ~5-8 weeks vacancy on turnover, expect pricing pressure); 100% of comp listings sitting > 30 days — soft ceiling on asking rent; 700 units permitted in Putnam County in 2024 (48 in 5+ unit buildings).
- Putnam County population projected at +16% by 2050 — long-run rental-demand tailwind backs the buy-and-hold thesis.
- Current owner paid $70k; list at $278k implies a 297% gain — meaningful room to come down on a strong offer.
- Cap rate 6.1% vs local median 3.1% in Cookeville — top-decile yield for the area; either an underpriced asset or a hidden risk that comps aren't pricing in. Stress-test before assuming the spread holds.
- This rent runs 35% of the median local income ($70k/yr) — at the standard rent-burdened threshold; future hikes will face affordability resistance.
Questions for listing agent
- What do current leases actually rent for vs. the listed asking? Can we see a recent rent roll and the last 12 months of T-12 income?
- It's been on market 40 days. Have you received any prior offers? Is the seller open to a 26% concession, seller financing, or rate buy-down credit?
- Is there a deadline driving the sale (1031 exchange, divorce, estate, relocation)? That informs how much negotiation room exists.
- Schools are D-rated, which usually means shorter tenancies and higher turnover. Who's the typical renter profile here, and what's been the actual vacancy rate?
- The area grade is low — what's the realistic commute time and amenity access for the typical tenant pool here? Any planned neighborhood developments (good or bad) we should know about?
- What's the average days-on-market for RENTAL listings here right now (not sales)? A rising rental-DOM trend means longer vacancies and softer asking-rent achievability than the comps imply.
- What's the recent tenant-quality profile in this submarket — average credit score on applications, eviction rate, late-payment / NSF rate, and stable-employment percentage? A property-management company in the area should have these aggregated.
- How much new for-sale + rental construction is in the pipeline within 1–3 miles? Heavy new supply typically softens prices + rents 12–24 months out; constrained supply supports both.
CashFlowRE · CFR-X3YVBG56D5G6HR
· Data 2 h ago
cashflowre.app · 2026-05-29