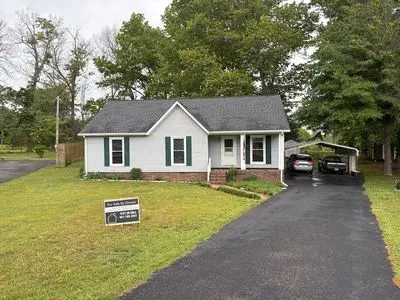
2857 Oak Park Dr · Cookeville, TN
Flood risk 1/10 · Minimal
- FEMA flood zone
- X (unshaded)
- Chance of flooding over 30 yrs
- 0.0%
- Est. flood insurance / yr
- $507 – $1,088
Fire risk 4/10 · Minor
- Est. fire insurance / yr
- $949 – $1,763
Heat risk 4/10 · Minor
- Hot days now (above 102°F)
- 7 days/yr
- Hot days in 30 yrs
- 20 days/yr
Wind risk 3/10 · Minor
- Chance of severe wind over 30 yrs
- 7.0%
Air-quality risk 2/10 · Minimal
- Unhealthy air days now
- 0 days/yr
- Unhealthy air days in 30 yrs
- 1 days/yr
Risk factors via First Street. Map © Google.
Why this score? — see what drove the D grade
The composite is a weighted blend of 9 inputs, each scored 0–100. Each bar is that input's sub-score; the figure is the points it added to the 100-point composite (weight × sub-score).
- Cash flow +12.6/30.0
- ARV discount +11.2/15.0
- Livability +3.8/5.0
- DSCR +3.7/10.0
- Schools +2.6/10.0
- Rent growth +2.5/5.0
- Condition / age +2.5/5.0
- 1% rule +2.4/10.0
- Appreciation +0.0/10.0
$278,000
🖨 Deal sheet (PDF) 📄 Offer letter ✓ Due diligence
Listing remarks
Country living on a quiet cul de sac in a rural subdivision just a few minutes from Algood School and Cookeville High School. Double-insulated home with vinyl over original wood Western Cedar. New roof in Aug 2022 by Risher Roofing with lifetime architectural asphalt shingles, and gutter guards replaced at that time. Trane 2.5 ton natural gas furnace/AC package unit with ECM motor & amp; fan control board replaced and blower assembly cleaned in Jan 2024, draft inducer fan replaced in Dec 2025. All windows replaced with double-hung easy tilt-wash. Partial glassed front & amp; rear doors with new storm doors. Septic tank properly maintained with periodical cleaning, last one in Jun 2
Key facts
- Double hung windows
- Quiet cul de sac
- New roof
Tags
Neighborhood map
What this means for you Summary
Snapshot
- This is a 3-bed/2.0-bath single-family listed at $278k.
Deal economics
- At list price, monthly cash flow is $-38 ($-452/yr) — negative.
- To cash-flow at today's rent, offer at most $271k (2.4% below list).
- To meet the 1% rule (rent ≥ 1% of price), the offer needs to be $205k (26.2% below list).
- Recommended offer: $205k (26.2% below list) — sets the bar for 1% rule.
- Cap rate 6.1% vs local median 3.1% in Cookeville — top-decile yield for the area; either an underpriced asset or a hidden risk that comps aren't pricing in. Stress-test before assuming the spread holds.
Location & tenants
- Location reads 76/100 on livability (#11 in TN, #3,551 nationally) — a middle-class / working-renter tenant base. Strengths: amenities A+, cost of living A+, health & safety A+; Watch: schools D-, commute F, employment F.
- Putnam County (town): math 32% / reading 31% proficiency, ranked #49 of 139 in TN (top 35%) — families likely to look elsewhere, expect single-tenant / working-renter base with shorter leases.
- Market conditions: 332 active listings in the ZIP; 4 comparable units currently listed for rent nearby; rentals lingering (median 45d on market — plan ~5-8 weeks vacancy on turnover, expect pricing pressure); 100% of comp listings sitting > 30 days — soft ceiling on asking rent; 700 units permitted in Putnam County in 2024 (48 in 5+ unit buildings).
- This rent runs 35% of the median local income ($70k/yr) — at the standard rent-burdened threshold; future hikes will face affordability resistance.
Forward outlook
- Local home prices are declining (-3.0%/yr); year-one equity from $2k of loan paydown is wiped out by about $8k of value loss. Plan a longer hold.
- Putnam County population projected at +16% by 2050 — long-run rental-demand tailwind backs the buy-and-hold thesis.
Negotiation context
- It's been on market 40 days — a 3% lower offer ($270k) is reasonable based on typical stale-listing flexibility.
- Current owner paid $70k; list at $278k implies a 297% gain — meaningful room to come down on a strong offer.
Questions for the listing agent
- What do current leases actually rent for vs. the listed asking? Can we see a recent rent roll and the last 12 months of T-12 income?
- It's been on market 40 days. Have you received any prior offers? Is the seller open to a 26% concession, seller financing, or rate buy-down credit?
- Is there a deadline driving the sale (1031 exchange, divorce, estate, relocation)? That informs how much negotiation room exists.
- Schools are D-rated, which usually means shorter tenancies and higher turnover. Who's the typical renter profile here, and what's been the actual vacancy rate?
- The area grade is low — what's the realistic commute time and amenity access for the typical tenant pool here? Any planned neighborhood developments (good or bad) we should know about?
- What's the average days-on-market for RENTAL listings here right now (not sales)? A rising rental-DOM trend means longer vacancies and softer asking-rent achievability than the comps imply.
- What's the recent tenant-quality profile in this submarket — average credit score on applications, eviction rate, late-payment / NSF rate, and stable-employment percentage? A property-management company in the area should have these aggregated.
- How much new for-sale + rental construction is in the pipeline within 1–3 miles? Heavy new supply typically softens prices + rents 12–24 months out; constrained supply supports both.
Investment metrics
- 1% rule
- 0.74% ✗
- Cap rate
- 6.13%
- Cash-on-cash
- -0.58%
- DSCR
- 0.97
- GRM
- 11.3
CMA / ARV
- ARV (on-the-fly)
- $302,736
- Comps found
- 12
Show comp detail 12 sales within ~0.75 mi
| Address | Dist | Beds/Ba | Sqft | Sold | Price | $/sf | Match |
|---|---|---|---|---|---|---|---|
| 2398 Nelson Way | 0.63mi | 3/2.0 | 1,495 (+1%) | 1mo | $305,000 | $204 | 69 |
| 2591 Suffolk Dr | 0.60mi | 3/2.0 | 1,458 (-2%) | 1mo | $355,500 | $244 | 68 |
| 2409 Couples Dr | 0.67mi | 3/2.0 | 1,485 (+0%) | 1mo | $342,030 | $230 | 68 |
| 2412 Couples Dr | 0.69mi | 3/2.0 | 1,495 (+1%) | 2mo | $354,330 | $237 | 65 |
| 2384 Nelson Way | 0.66mi | 3/2.0 | 1,495 (+1%) | 9mo | $331,830 | $222 | 61 |
| 1646 Links Dr | 0.69mi | 3/2.0 | 1,495 (+1%) | 8mo | $321,930 | $215 | 60 |
| 1514 Quinland Lake Rd | 0.55mi | 3/2.0 | 1,403 (-6%) | 8mo | $260,000 | $185 | 58 |
| 2300 Peppermint Dr | 0.60mi | 3/1.5 | 1,539 (+4%) | 8mo | $230,000 | $149 | 57 |
| 2385 Nelson Way | 0.69mi | 4/2.5 (+1) | 1,651 (+11%) | 1mo | $319,000 | $193 | 41 |
| 2378 Nelson Way | 0.68mi | 3/2.5 | 1,659 (+12%) | 7mo | $314,900 | $190 | 41 |
| 2303 Pine Hill Rd | 0.69mi | 3/2.0 | 1,682 (+13%) | 8mo | $315,000 | $187 | 39 |
| 2388 Nelson Way | 0.65mi | 4/2.5 (+1) | 1,659 (+12%) | 8mo | $331,200 | $200 | 36 |
Match score weights: distance 35% · size 25% · config 20% · recency 20%. Top-matched comps best support the ARV.
Projected returns pro-forma
-3.0% appreciation · 3.0% rent growth · sell at horizon
- IRR
- -17.3%
- Equity multiple
- 0.39×
- Total profit
- $-47,577
- Equity at exit
- $41,451
- IRR
- -9.4%
- Equity multiple
- 0.42×
- Total profit
- $-45,049
- Equity at exit
- $24,036
Cash invested: $77,840 (down + closing). Projections, not guarantees.
Landlord ↔ Tenant lean methodology
- Overall (STATE)
- 87 Strongly Landlord-Friendly
- State Tennessee
- 87 Strongly Landlord-Friendly · R+13
- County
- — inherits STATE
- City
- — inherits STATE
ZIP-level market 38506
- Home prices YoY
- -20.1%
- Active inventory
- 332
- Price-to-rent
- 11.3×
Monthly cashflow live
- Estimated rent
- $2,052 medium interval (Pro) →
- Mortgage (P&I)
- −$1,458
- Tax from tax record
- −$85 /mo · $1,017/yr
- Insurance
- −$116
- HOA
- −$0
- Vacancy / Maint / Mgmt
- −$431
- Net cashflow
- $-38
Break-even live
Sensitivity live
| Price | -10% $120 | -5% $41 | +0% $-38 | +5% $-116 | +10% $-195 |
|---|---|---|---|---|---|
| Rent | -10% $-200 | -5% $-119 | +0% $-38 | +5% $43 | +10% $124 |
| Rate | -1.0pp $102 | -0.5pp $33 | base $-38 | +0.5pp $-110 | +1.0pp $-183 |
UW: 25.0% down · 7.5% · 30yr · 1.5% tax · 5.0% vac · 8.0% maint · 8.0% mgmt
Financing live
Cash to close
- Down payment
- $69,500
- Closing costs
- $8,340
- Reserves months
- —
- Total cash needed
- —
Loan-product check · same deal, 3 products live
Conventional
25% down · 7.5% · 30yr
- Down + closing
- —
- Monthly P&I
- —
- Monthly cashflow
- —
- DSCR
- —
- Eligible?
- —
Personal DTI + credit; lowest rate.
DSCR
20% down · 8.5% · 30yr
- Down + closing
- —
- Monthly P&I
- —
- Monthly cashflow
- —
- DSCR
- —
- Eligible?
- —
No personal income docs; deal must DSCR.
Hard money
10% down · 12.0% · 12mo
- Down + closing
- —
- Monthly P&I
- —
- Monthly cashflow
- —
- DSCR
- —
- Eligible?
- —
Short-term bridge; refi at stabilization.
Rent comps 4 comps
| Address | Beds | Baths | Sqft | Rent | $/sqft | DOM | Units | Dist |
|---|---|---|---|---|---|---|---|---|
| 255 Quinland Lake Rd Cookeville, TN | 3.0–4.0 | 2.0 | 1354 | $756 | $0.56 | 45d | 1 | 0.68mi |
| 1625 Daly Dr Cookeville, TN | 3.0 | 2.5 | 1559 | $2,200 | $1.41 | 45d | 1 | 0.81mi |
| 1606 Bobby Nichols Dr Cookeville, TN | 3.0 | 2.0 | 1556 | $1,900 | $1.22 | 45d | 1 | 0.95mi |
| 1301 Fisk Rd Cookeville, TN | 3.0 | 2.5 | 1818 | $1,900 | $1.05 | 45d | 1 | 1.48mi |
Listing history 20 events
-
2026-06-22days on market $278,000 Active 40 DOM
-
2026-06-19days on market $278,000 Active 38 DOM
-
2026-06-18days on market $278,000 Active 37 DOM
-
2026-06-17days on market $278,000 Active 36 DOM
-
2026-06-16days on market $278,000 Active 35 DOM
-
2026-06-15days on market $278,000 Active 34 DOM
-
2026-06-14days on market $278,000 Active 32 DOM
-
2026-06-13days on market $278,000 Active 31 DOM
-
2026-06-10days on market $278,000 Active 29 DOM
-
2026-06-09days on market $278,000 Active 28 DOM
-
2026-06-08days on market $278,000 Active 27 DOM
-
2026-06-07days on market $278,000 Active 26 DOM
-
2026-06-05days on market $278,000 Active 23 DOM
-
2026-06-02days on market $278,000 Active 21 DOM
-
2026-06-01days on market $278,000 Active 20 DOM
-
2026-05-31days on market $278,000 Active 19 DOM
-
2026-05-30days on market $278,000 Active 18 DOM
-
2026-05-12$278,000 Active 2914-char remark
-
1996-01-04soldstatus $70,000
-
1987-06-25soldstatus $45,000
ⓘ Source: listings_history table (triggers on properties + properties_extension) + one-shot
backfill from property_details.listing_events for pre-trigger history.
Tax reassessment forecast TN · Resets to sale price
- Current annual tax
- $1,017 · $85/mo
- Projected year-2 tax
- $1,974 · $164/mo
- Expected delta
- +$957/yr (+$80/mo · 94.1%)
ⓘ Screening estimate from a state-policy table — verify with the county assessor before closing.
Climate risk First Street
- Flood 1/10 Low FEMA zone X (unshaded) · 0% chance over 30 yrs
- Wildfire 4/10 Moderate
- Heat 4/10 Moderate 7 d/yr ≥102°F today · 20 d/yr by 30 yrs out
- Wind 3/10 Moderate 7% chance of damaging wind over 30 yrs
- Air quality 2/10 Low 0 unhealthy d/yr today · 1 by 30 yrs out
Nearby sold comps map
Loading sold comps map…
Walkable amenities ~0.75 mi
Loading nearby amenities…
Taxation est. · year 1
- Rental income
- $24,619
- − Mortgage interest
- −$15,572
- − Property taxes
- −$1,017
- − Insurance
- −$1,390
- − Repairs & maintenance
- −$1,970
- − Management
- −$1,970
- − Depreciation
- −$8,087
- Taxable loss
- −$5,386
- Est. tax savings @ 24.0%
- +$1,293
- After-tax cash flow
- $841/yr
For passive investors: Depreciation is non-cash, so a rental often shows a tax loss while cash-flowing — sheltering income. Rental losses are passive: they offset passive income freely, and up to $25,000/yr can offset ordinary (W-2) income if you actively participate and your MAGI is under $100k (phasing out to $0 by $150k); unused losses carry forward. On sale, claimed depreciation is recaptured at up to 25%, and gains may owe capital-gains tax (a 1031 exchange can defer both). Figures are a year-1 estimate at your 24.0% rate — not tax advice; consult a CPA.
Schools (NCES district)
- District
- Putnam County
- NCES district ID
- 4703480
- Math proficiency
- 32% ▼ -6.00%
- Reading proficiency
- 31% ▼ -5.00%
- Median HH income
- $35,738
- Composite
- 26.09/100
- National rank
- #7291
- State rank
- #49 of 139 in TN
Livability — Cookeville
- Score
- 76/100
- State rank
- #11
- US rank
- #3551
Category grades
Schools grade is shown separately in the Schools card above.
Census & demographics
- County
- Putnam County · 72,571 people
- City population
- 72,571
- Metro
- Cookeville, TN
- Population (ZIP)
- 30,100
- Household income
- $70,279
- Rent vs Own
- Severe rent burden
- 415.0
Population outlook (Putnam County) Hauer SSP2
- Today (2025)
- 80,122 people
- By 2030
- 82,798 · +3.3%
- By 2040
- 87,913 · +9.7%
- By 2050
- 92,659 · +15.6%
- By 2075
- 104,965 · +31.0%
- By 2100
- 113,256 · +41.4%
Race, ethnicity, and origin ACS 2023
- Neighborhood character
- Predominantly White (92%)
- Race & ethnicity
- White 92% Hispanic / Latino 5% Two or more races 4%
- Hispanic origin (detail)
- Mexican 1%
- Common ancestry
- Lithuanian 3% Slovak 3% Serbian 2%
- Foreign-born
- 4% · Canada
- Languages at home
- 96% English-only · Spanish 2%
Political lean MEDSL · Putnam
- 2024 margin
- Solid R (+47.4) · D 25.7% · R 73.1% · Other 1.1%
- 2008→2024 swing
- -20.5pp toward R · 2008: -26.9pp · 2024: -47.4pp
- All cycles
- 2024: R+47.4 2020: R+43.4 2016: R+45.0 2012: R+37.1 2008: R+26.9
Not yet ingested
- Civics
- —
Market trends
- HPI YoY
- ▼ -72.51%
- Current HPI
- 288.5877
- Rent YoY
- —
- Metro
- Cookeville, TN
- State GDP YoY
- ▲ 2.78%
- F500 in state
- 22
Industry mix (Fortune 500 HQ in TN)
| Industry | F500 HQs | Revenue |
|---|---|---|
| Healthcare | 3 | $91B |
|
||
| Retail | 3 | $72B |
|
||
| Transportation / Logistics | 1 | $88B |
|
||
| Paper / Packaging | 1 | $19B |
|
||
| Insurance | 1 | $13B |
|
||
| Energy | 1 | $12B |
|
||
Price history
+517.8% since first listed3 events — show timeline
- 2026-05-12 Listed $278,000 FSBO.com
- 1996-01-04 Sold (Public Records) $70,000 Public Records
- 1987-06-25 Sold (Public Records) $45,000 Public Records
Property tax history
+4.7%/yrLatest (2025): $1,017 · +0.0% YoY. Source: county tax records.
Cash-flow waterfall
monthlySold comps — $/sqft
last 12 mo · ≤1 miLoading sold comps…