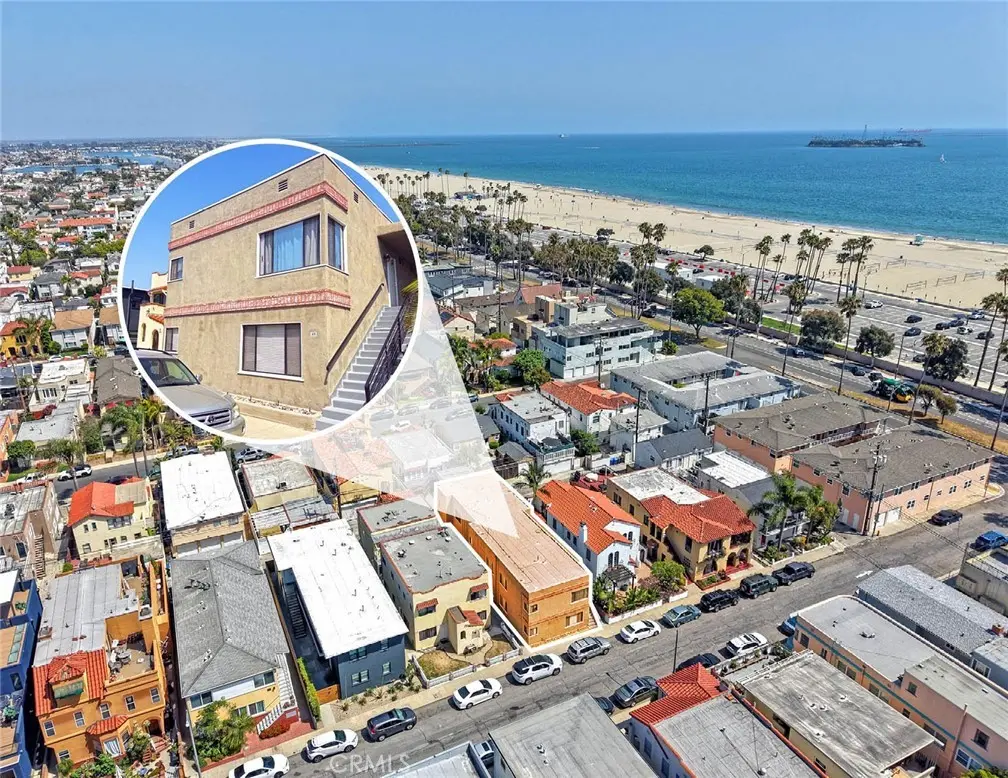
40 Ximeno
Long Beach, CA 90803
$1,895,000D-
7 bd · 6.0 ba ·
3,890 sqft ·
Built 1949
· MultiFamily
· Active
· 1 DOM
Cashflow @ list (25.0% down · 7.5%)
Estimated rent
$13,343/mo
Mortgage (P&I)
−$9,938
Tax + insurance
−$1,716
HOA
−$0
Vac / Maint / Mgmt
−$2,802
Net cashflow
$-1,113/mo
Annual
$-13,356/yr
Cap rate
5.59%
Cash-on-cash
-2.52%
DSCR
0.89
1% rule
0.70%
Cash to close
$530,600
Investor read
- This is a 5×1bd/1.0ba + 1×2bd/1.0ba units multifamily listed at $1.90M.
- At list price, monthly cash flow is $-1k ($-13k/yr) — negative. Per door: $-186/mo.
- To cash-flow at today's rent, offer at most $1.70M (10.4% below list).
- To meet the 1% rule (rent ≥ 1% of price), the offer needs to be $1.33M (29.6% below list).
- Only 1 days on market — expect competitive offers; lowballing is unlikely to land.
- Recommended offer: $1.33M (29.6% below list) — sets the bar for 1% rule.
- Local home prices are declining (-3.0%/yr); year-one equity from $13k of loan paydown is wiped out by about $57k of value loss. Plan a longer hold.
- Location reads 67/100 on livability (#319 in CA) — a middle-class / working-renter tenant base. Strengths: amenities A+, commute A+, employment B+; Watch: health & safety C-, crime F, cost of living F.
- Long Beach Unified (urban): math 34% / reading 50% proficiency, ranked #216 of 517 in CA (top 42%) — families likely to look elsewhere, expect single-tenant / working-renter base with shorter leases.
- Watch-outs: built in 1949 — expect roof / HVAC / electrical / plumbing capex.
- Market conditions: Rents rising (+1.7%/yr); 135 active listings in the ZIP; high-income renter base; 19,697 units permitted in Los Angeles County in 2024 (9,426 in 5+ unit buildings).
- Los Angeles County population projected at +9% by 2050 — modest demand growth; plan on rents tracking national, not racing it.
- Current owner paid $400k; list at $1.90M implies a 374% gain — meaningful room to come down on a strong offer.
- Cap rate 5.6% vs local median 1.9% in Long Beach — top-decile yield for the area; either an underpriced asset or a hidden risk that comps aren't pricing in. Stress-test before assuming the spread holds.
- At $13,343/mo this rent would consume 140% of the median local household income ($115k/yr) (locally 1537% of renters already pay >50% of income on rent) — very limited rent-growth headroom before tenants either downsize or default.
Questions for listing agent
- What do current leases actually rent for vs. the listed asking? Can we see a recent rent roll and the last 12 months of T-12 income?
- Can we see the unit-by-unit rent roll, current vacancy, and any below-market leases? What's the average tenancy length?
- What capital expenditures (roof, boiler, parking lot, exteriors) have been made in the last 5 years, and what's planned in the next 2?
- Built in 1949 — when were the roof, HVAC, electrical panel, plumbing, and water heater last replaced?
- Is there a deadline driving the sale (1031 exchange, divorce, estate, relocation)? That informs how much negotiation room exists.
- Crime grade is F in this area — have there been break-ins, vandalism, or insurance claims at this property in the last 3 years? What carrier currently insures it and at what premium?
- The area grade is low — what's the realistic commute time and amenity access for the typical tenant pool here? Any planned neighborhood developments (good or bad) we should know about?
- What's the average days-on-market for RENTAL listings here right now (not sales)? A rising rental-DOM trend means longer vacancies and softer asking-rent achievability than the comps imply.
CashFlowRE · CFR-X4RAW080GJQC2K
· Data 1 day ago
cashflowre.app · 2026-05-29