 6-Plex
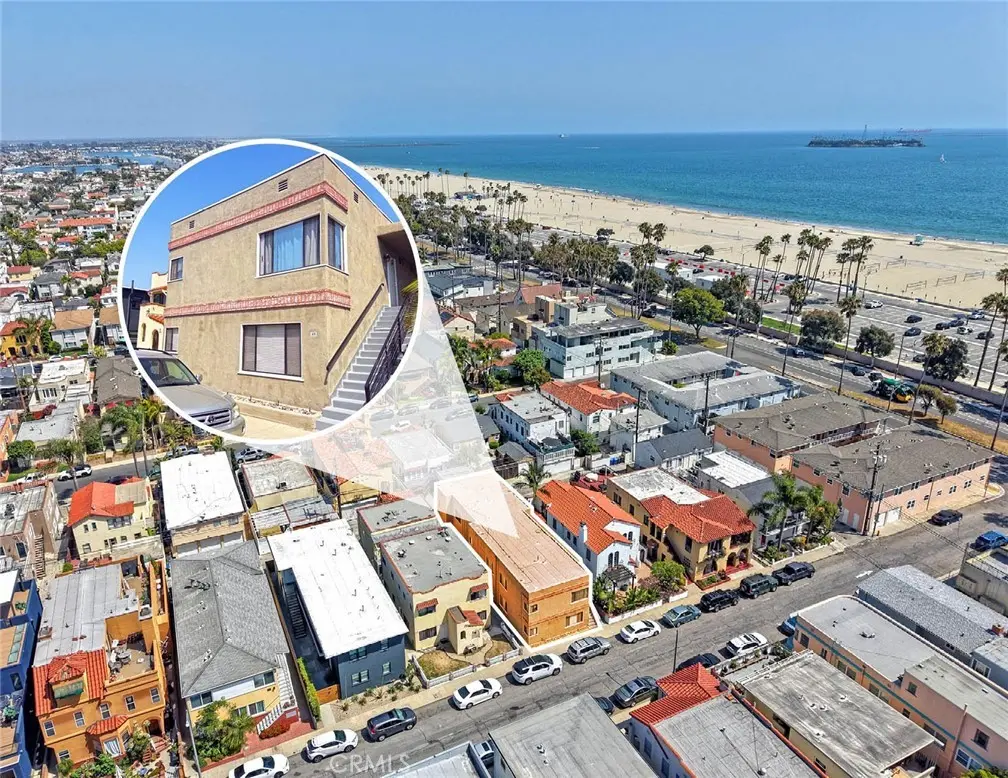
40 Ximeno · Long Beach, CA
Flood risk 1/10 · Minimal
- FEMA flood zone
- X (unshaded)
- Chance of flooding over 30 yrs
- 0.0%
- Est. flood insurance / yr
- $507 – $1,088
Fire risk 1/10 · Minimal
- Est. fire insurance / yr
- $659 – $1,223
Heat risk 4/10 · Minor
- Hot days now (above 86°F)
- 7 days/yr
- Hot days in 30 yrs
- 23 days/yr
Wind risk 1/10 · Minimal
- Chance of severe wind over 30 yrs
- —
Air-quality risk 5/10 · Moderate
- Unhealthy air days now
- 7 days/yr
- Unhealthy air days in 30 yrs
- 9 days/yr
Risk factors via First Street. Map © Google.
Why this score? — see what drove the D- grade
The composite is a weighted blend of 9 inputs, each scored 0–100. Each bar is that input's sub-score; the figure is the points it added to the 100-point composite (weight × sub-score).
- ARV discount +11.7/15.0
- Cash flow +10.1/30.0
- Schools +3.7/10.0
- Livability +3.4/5.0
- DSCR +2.9/10.0
- Rent growth +2.9/5.0
- Condition / age +2.5/5.0
- 1% rule +2.0/10.0
- Appreciation +0.0/10.0
$1,895,000
🖨 Deal sheet 📄 Offer letter ✓ Due diligence
Multi-family units
County records classify this as Multi-Family (5+ Unit). Listing-text estimate: 6 units. confirmed
5+ unit building — per-unit beds/baths from public records are typically unavailable; the breakdown below (if shown) is an estimate from the listing text.
Listing remarks
Exciting opportunity to acquire the prime Belmont Shore apartment building located at 40 Ximeno Avenue in Long Beach! This asset is just five parcels from Ocean Avenue and the sand in a sought-after affluent coastal market. Current rents are 50 percent below market, making this an excellent value-add opportunity in a high demand submarket. 40 Ximeno Avenue offers a diverse mix of one studio with a large walk-in closet, four one-bedroom/one-bath units, and one two-bedroom/one-bath unit with a den. Of the six units, five feature new vinyl plank flooring and four boast new showers. The property also features a newer roof, laundry facilities, one covered parking space, and a storage space. The
Key facts
- Laundry facilities
- Newer roof
- New showers
Tags
Property features AI
Finance
- Financial info: Total building area 3,890; Gross scheduled income $122,220; Gross income $122,220; Net operating income $71,804; Gross multiplier 15.5; Operating expenses $46,749; Unit-level rents and counts: one unit renting at $750 (1 bath), four units totaling $2,650 (1 bed, 1 bath each), one unit renting at $2,250 (2 bed, 1 bath)
- HOA & community: Rent controlled
Exterior
- Parking: One garage space; One total parking space
- Utilities: Public sewer; District/public water; Six separate gas meters; Six separate electric meters
- Home design: Multi-unit property (6 units); Two-story building; Single building on parcel; No accessory dwelling unit
- Construction: Year built from assessor records
- Exterior features: No pool; Rectangular lot shape; Suburban setting
Interior
- Kitchen: Kitchens included in each unit
- Bedrooms: Units include 1- and 2-bedroom layouts
- Bathrooms: Each unit has one full bathroom
- Interior features: Entry at ground level; No common walls (detached building)
- Laundry & utility: Community laundry
Neighborhood map
What this means for you Summary
Snapshot
- This is a 5×1bd/1.0ba + 1×2bd/1.0ba units multifamily listed at $1.90M.
Deal economics
- At list price, monthly cash flow is $-1k ($-13k/yr) — negative. Per door: $-186/mo.
- To cash-flow at today's rent, offer at most $1.70M (10.4% below list).
- To meet the 1% rule (rent ≥ 1% of price), the offer needs to be $1.33M (29.6% below list).
- Recommended offer: $1.33M (29.6% below list) — sets the bar for 1% rule.
- Cap rate 5.6% vs local median 1.9% in Long Beach — top-decile yield for the area; either an underpriced asset or a hidden risk that comps aren't pricing in. Stress-test before assuming the spread holds.
Location & tenants
- Location reads 67/100 on livability (#319 in CA) — a middle-class / working-renter tenant base. Strengths: amenities A+, commute A+, employment B+; Watch: health & safety C-, crime F, cost of living F.
- Long Beach Unified (urban): math 34% / reading 50% proficiency, ranked #216 of 517 in CA (top 42%) — families likely to look elsewhere, expect single-tenant / working-renter base with shorter leases.
- Market conditions: Rents rising (+1.7%/yr); 135 active listings in the ZIP; high-income renter base; 19,697 units permitted in Los Angeles County in 2024 (9,426 in 5+ unit buildings).
- At $13,343/mo this rent would consume 140% of the median local household income ($115k/yr) (locally 1537% of renters already pay >50% of income on rent) — very limited rent-growth headroom before tenants either downsize or default.
Forward outlook
- Local home prices are declining (-3.0%/yr); year-one equity from $13k of loan paydown is wiped out by about $57k of value loss. Plan a longer hold.
- Los Angeles County population projected at +9% by 2050 — modest demand growth; plan on rents tracking national, not racing it.
Negotiation context
- Only 1 days on market — expect competitive offers; lowballing is unlikely to land.
- Current owner paid $400k; list at $1.90M implies a 374% gain — meaningful room to come down on a strong offer.
Risks & watch-outs
- Watch-outs: built in 1949 — expect roof / HVAC / electrical / plumbing capex.
Questions for the listing agent
- What do current leases actually rent for vs. the listed asking? Can we see a recent rent roll and the last 12 months of T-12 income?
- Can we see the unit-by-unit rent roll, current vacancy, and any below-market leases? What's the average tenancy length?
- What capital expenditures (roof, boiler, parking lot, exteriors) have been made in the last 5 years, and what's planned in the next 2?
- Built in 1949 — when were the roof, HVAC, electrical panel, plumbing, and water heater last replaced?
- Is there a deadline driving the sale (1031 exchange, divorce, estate, relocation)? That informs how much negotiation room exists.
- Crime grade is F in this area — have there been break-ins, vandalism, or insurance claims at this property in the last 3 years? What carrier currently insures it and at what premium?
- The area grade is low — what's the realistic commute time and amenity access for the typical tenant pool here? Any planned neighborhood developments (good or bad) we should know about?
- What's the average days-on-market for RENTAL listings here right now (not sales)? A rising rental-DOM trend means longer vacancies and softer asking-rent achievability than the comps imply.
- What's the recent tenant-quality profile in this submarket — average credit score on applications, eviction rate, late-payment / NSF rate, and stable-employment percentage? A property-management company in the area should have these aggregated.
- How much new apartment / multifamily construction is in the pipeline within 1–3 miles? Heavy new supply (>2% of stock underway) typically softens rents 12–24 months out; light construction supports rent growth.
Investment metrics
- 1% rule
- 0.70% ✗
- Cap rate
- 5.59%
- Cash-on-cash
- -2.52%
- DSCR
- 0.89
- GRM
- 11.8
CMA / ARV
- ARV (on-the-fly)
- $2,088,930
- Comps found
- 5
Show comp detail 5 sales within ~0.75 mi
| Address | Dist | Beds/Ba | Sqft | Sold | Price | $/sf | Match |
|---|---|---|---|---|---|---|---|
| 209 Mira Mar Ave | 0.38mi | 6/6.0 (-1) | 3,604 (-7%) | 1mo | $1,525,000 | $423 | 64 |
| 3701 E Broadway | 0.52mi | 7/6.0 | 3,898 (+0%) | 16mo | $1,950,000 | $500 | 62 |
| 25 Bennett Ave | 0.07mi | 7/8.0 | 3,344 (-14%) | 18mo | $2,450,000 | $733 | 50 |
| 133 Corona Ave | 0.40mi | 6/5.0 (-1) | 3,312 (-15%) | 15mo | $1,778,000 | $537 | 35 |
| 5261 E The Toledo | 0.68mi | 8/8.0 (+1) | 4,468 (+15%) | 22mo | $3,300,000 | $739 | 12 |
Match score weights: distance 35% · size 25% · config 20% · recency 20%. Top-matched comps best support the ARV.
Projected returns pro-forma
-3.0% appreciation · 1.68% rent growth · sell at horizon
- IRR
- -21.8%
- Equity multiple
- 0.25×
- Total profit
- $-396,137
- Equity at exit
- $282,551
- IRR
- -18.9%
- Equity multiple
- 0.04×
- Total profit
- $-508,907
- Equity at exit
- $163,845
Cash invested: $530,600 (down + closing). Projections, not guarantees.
Landlord ↔ Tenant lean methodology
- Overall (STATE)
- 18 Strongly Tenant-Friendly
- State California
- 18 Strongly Tenant-Friendly · D+13
- County
- — inherits STATE
- City
- — inherits STATE
ZIP-level market 90803
- Rents YoY
- 1.7%
- Active inventory
- 135
- Price-to-rent
- 72.0×
Monthly cashflow live
- Estimated rent
- $13,343 high interval (Pro) →
- Mortgage (P&I)
- −$9,938
- Tax from tax record
- −$927 /mo · $11,122/yr
- Insurance
- −$790
- HOA
- −$0
- Vacancy / Maint / Mgmt
- −$2,802
- Net cashflow
- $-1,113
Break-even live
6-unit breakdown (identical units grouped — click to expand)
| Units | Beds | Baths | Est. rent |
|---|---|---|---|
| 5× units | 1 | 1 | $10,965 |
| #1 | 1 | 1 | $2,193 |
| #2 | 1 | 1 | $2,193 |
| #3 | 1 | 1 | $2,193 |
| #4 | 1 | 1 | $2,193 |
| #5 | 1 | 1 | $2,193 |
| 1× unit | 2 | 1 | $2,378 |
| Total (6 units) | $13,343 | ||
UW: 25.0% down · 7.5% · 30yr · 1.5% tax · 5.0% vac · 8.0% maint · 8.0% mgmt
Financing live
Cash to close
- Down payment
- $473,750
- Closing costs
- $56,850
- Reserves months
- —
- Total cash needed
- —
Loan-product check · same deal, 3 products live
Conventional
25% down · 7.5% · 30yr
- Down + closing
- —
- Monthly P&I
- —
- Monthly cashflow
- —
- DSCR
- —
- Eligible?
- —
Personal DTI + credit; lowest rate.
DSCR
20% down · 8.5% · 30yr
- Down + closing
- —
- Monthly P&I
- —
- Monthly cashflow
- —
- DSCR
- —
- Eligible?
- —
No personal income docs; deal must DSCR.
Hard money
10% down · 12.0% · 12mo
- Down + closing
- —
- Monthly P&I
- —
- Monthly cashflow
- —
- DSCR
- —
- Eligible?
- —
Short-term bridge; refi at stabilization.
Listing history 2 events
-
2026-06-18remarks 699-char remark
-
2026-06-18$1,895,000 Active 1 DOM
ⓘ Source: listings_history table (triggers on properties + properties_extension) + one-shot
backfill from property_details.listing_events for pre-trigger history.
Tax reassessment forecast CA · Resets to sale price
- Current annual tax
- $11,122 · $927/mo
- Projected year-2 tax
- $14,402 · $1,200/mo
- Expected delta
- +$3,280/yr (+$273/mo · 29.5%)
ⓘ Screening estimate from a state-policy table — verify with the county assessor before closing.
Climate risk First Street
- Flood 1/10 Low FEMA zone X (unshaded) · 0% chance over 30 yrs
- Wildfire 1/10 Low
- Heat 4/10 Moderate 7 d/yr ≥86°F today · 23 d/yr by 30 yrs out
- Wind 1/10 Low
- Air quality 5/10 Major 7 unhealthy d/yr today · 9 by 30 yrs out
Nearby sold comps map
Loading sold comps map…
Walkable amenities ~0.75 mi
Loading nearby amenities…
Taxation est. · year 1
- Rental income
- $160,116
- − Mortgage interest
- −$106,149
- − Property taxes
- −$11,122
- − Insurance
- −$9,475
- − Repairs & maintenance
- −$12,809
- − Management
- −$12,809
- − Depreciation
- −$55,127
- Taxable loss
- −$47,376
- Est. tax savings @ 24.0%
- +$11,370
- After-tax cash flow
- $-1,986/yr
For passive investors: Depreciation is non-cash, so a rental often shows a tax loss while cash-flowing — sheltering income. Rental losses are passive: they offset passive income freely, and up to $25,000/yr can offset ordinary (W-2) income if you actively participate and your MAGI is under $100k (phasing out to $0 by $150k); unused losses carry forward. On sale, claimed depreciation is recaptured at up to 25%, and gains may owe capital-gains tax (a 1031 exchange can defer both). Figures are a year-1 estimate at your 24.0% rate — not tax advice; consult a CPA.
Schools (NCES district)
- District
- Long Beach Unified
- NCES district ID
- 0622500
- Math proficiency
- 34% ▼ -11.00%
- Reading proficiency
- 50% ▼ -4.00%
- Median HH income
- $56,092
- Composite
- 36.67/100
- National rank
- #4607
- State rank
- #216 of 517 in CA
Livability — Long Beach
- Score
- 67/100
- State rank
- #319
- US rank
- #10758
Category grades
Schools grade is shown separately in the Schools card above.
Census & demographics
- Census place
- Long Beach, CA
- County
- Los Angeles County · 9,444,647 people
- City population
- 466,088
- Metro
- Los Angeles-Long Beach-Anaheim, CA
- Population (ZIP)
- 31,526
- Household income
- $114,656
- Rent vs Own
- Severe rent burden
- 1537.0
Population outlook (Los Angeles County) Hauer SSP2
- Today (2025)
- 10,940,515 people
- By 2030
- 11,256,481 · +2.9%
- By 2040
- 11,729,929 · +7.2%
- By 2050
- 11,948,407 · +9.2%
- By 2075
- 11,818,114 · +8.0%
- By 2100
- 10,842,928 · -0.9%
Race, ethnicity, and origin ACS 2023
- Neighborhood character
- Majority White (65%)
- Race & ethnicity
- White 65% Hispanic / Latino 19% Two or more races 10% Asian 6% Black 3% Native American 1% Pacific Islander 1%
- Hispanic origin (detail)
- Mexican 12%
- Common ancestry
- Italian 3% Romanian 3% Lithuanian 2%
- Foreign-born
- 14% · Canada, China, Jamaica
- Languages at home
- 84% English-only · Spanish 9% Other Asian/Pacific 2% Tagalog/Filipino 1%
Political lean MEDSL · Los Angeles
- 2024 margin
- Solid D (+32.9) · D 64.8% · R 31.9% · Other 3.3%
- 2008→2024 swing
- -7.4pp toward R · 2008: 40.4pp · 2024: 32.9pp
- All cycles
- 2024: D+32.9 2020: D+44.2 2016: D+48.0 2012: D+40.0 2008: D+40.4
Not yet ingested
- Civics
- —
Market trends
- HPI YoY
- ▼ -634.69%
- Current HPI
- 377.3105
- Rent YoY
- ▲ 1.68%
- Metro
- Los Angeles-Long Beach-Anaheim, CA
- State GDP YoY
- ▲ 3.21%
- F500 in state
- 116
Industry mix (Fortune 500 HQ in CA)
| Industry | F500 HQs | Revenue |
|---|---|---|
| Technology | 27 | $1,492B |
|
||
| Financial Services | 3 | $174B |
|
||
| Retail | 3 | $44B |
|
||
| Insurance | 3 | $26B |
|
||
| Media / Entertainment | 2 | $115B |
|
||
| Pharmaceuticals / Biotech | 2 | $62B |
|
||
Price history
+373.8% since first listed2 events — show timeline
- 2026-06-18 Listed $1,895,000 CRMLS
- 1986-10-16 Sold (Public Records) $400,000 Public Records
Property tax history
+2.8%/yrLatest (2025): $11,122 · +4.7% YoY. Source: county tax records.
Cash-flow waterfall
monthlySold comps — $/sqft
last 12 mo · ≤1 miLoading sold comps…