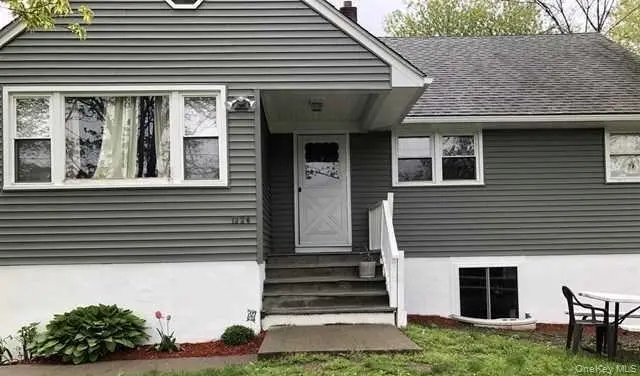
1224 RT 9G
Haviland, NY 12538
$625,000D-
7 bd · 3.0 ba ·
2,050 sqft ·
Built 1956
· MultiFamily
· Active
· 48 DOM
Cashflow @ list (25.0% down · 7.5%)
Estimated rent
$4,805/mo
Mortgage (P&I)
−$3,278
Tax + insurance
−$938
HOA
−$0
Vac / Maint / Mgmt
−$1,009
Net cashflow
$-419/mo
Annual
$-5,030/yr
Cap rate
5.49%
Cash-on-cash
-2.87%
DSCR
0.87
1% rule
0.77%
Cash to close
$175,000
Investor read
- This is a 1×3bd/1ba + 2×2bd/1ba units multifamily listed at $625k.
- At list price, monthly cash flow is $-419 ($-5k/yr) — negative. Per door: $-140/mo.
- To cash-flow at today's rent, offer at most $551k (11.8% below list).
- To meet the 1% rule (rent ≥ 1% of price), the offer needs to be $480k (23.1% below list).
- It's been on market 48 days — a 3% lower offer ($606k) is reasonable based on typical stale-listing flexibility.
- Recommended offer: $480k (23.1% below list) — sets the bar for 1% rule.
- Local home prices are declining (-3.0%/yr); year-one equity from $4k of loan paydown is wiped out by about $19k of value loss. Plan a longer hold.
- Location reads 65/100 on livability (#712 in NY) — a middle-class / working-renter tenant base. Strengths: housing A+, crime A-, employment A-; Watch: cost of living C-, amenities F, commute F.
- Hyde Park Central School District (rural): math 43% / reading 62% proficiency, ranked #316 of 590 in NY (top 54%) — acceptable for families but not a draw, mixed tenant base, ~2y average lease.
- Zoned schools: Ralph R Smith School (math 22% / reading 32%, grade F, #1,786 of 2,108 statewide, top 86%, 340 students, 54% FRL); Haviland Middle School (math 23% / reading 57%, grade F, #413 of 729 statewide, top 57%, 759 students, 59% FRL); Franklin D Roosevelt Senior High School (math 93% / reading 90%, grade A+, #197 of 1,100 statewide, top 18%, 1,136 students, 52% FRL) — zoned schools average 55% FRL vs 34% district-wide (21 pts higher); higher-poverty schools than district average — tighter screening recommended.
- Watch-outs: built in 1956 — expect roof / HVAC / electrical / plumbing capex.
- Market conditions: 98 active listings in the ZIP; 620 units permitted in Dutchess County in 2024 (242 in 5+ unit buildings).
- Dutchess County population projected at -11% by 2050 — secular population decline; favor cash flow + early exit over multi-decade hold.
- Cap rate 5.5% vs local median 4.2% in Haviland — top-decile yield for the area; either an underpriced asset or a hidden risk that comps aren't pricing in. Stress-test before assuming the spread holds.
Questions for listing agent
- What do current leases actually rent for vs. the listed asking? Can we see a recent rent roll and the last 12 months of T-12 income?
- It's been on market 48 days. Have you received any prior offers? Is the seller open to a 23% concession, seller financing, or rate buy-down credit?
- Can we see the unit-by-unit rent roll, current vacancy, and any below-market leases? What's the average tenancy length?
- What capital expenditures (roof, boiler, parking lot, exteriors) have been made in the last 5 years, and what's planned in the next 2?
- Built in 1956 — when were the roof, HVAC, electrical panel, plumbing, and water heater last replaced?
- Is there a deadline driving the sale (1031 exchange, divorce, estate, relocation)? That informs how much negotiation room exists.
- The area grade is low — what's the realistic commute time and amenity access for the typical tenant pool here? Any planned neighborhood developments (good or bad) we should know about?
- What's the average days-on-market for RENTAL listings here right now (not sales)? A rising rental-DOM trend means longer vacancies and softer asking-rent achievability than the comps imply.
CashFlowRE · CFR-X4ZMZZ106GQX3Q
· Data 1 day ago
cashflowre.app · 2026-05-29